
Comparing IAG and AF-KLM’s Q2 performance
How well are the two airline groups coping with recent fuel and market disruption?
It was always going to be the case that the first full quarter following the start of the Iran war was going to be a tough one for airlines, given the more than doubling of the fuel price that came with it.
We’ve now started to get the Q2 figures in and I wanted to take a look at how well airlines are coping in practice. There are many interesting aspects to look at, such as seeing how effective the fuel hedging programmes will prove to have been, what has happened to demand, and how successful airlines have been in passing on the cost increase in higher prices.
Of the big three Western European network airline groups, IAG and AF-KLM reported last week and I’ve had a chance to do a proper analysis, so I thought I’d get on with publishing that comparison. We just got Lufthansa’s results this morning and at a first “AI assisted” glance, many of the trends were quite similar but they were probably the worst of the three. Expect a follow up post once I’ve had an opportunity to do the analysis.
Meanwhile, back to the IAG versus AF-KLM review.
The bottom line
When it comes to profit margins, there wasn’t a big difference in the hit each took compared to last year. AF-KLM’s margin dropped by 3.5 points, whilst IAG’s margin fell by 3.1 points (excluding exceptional restructuring costs).
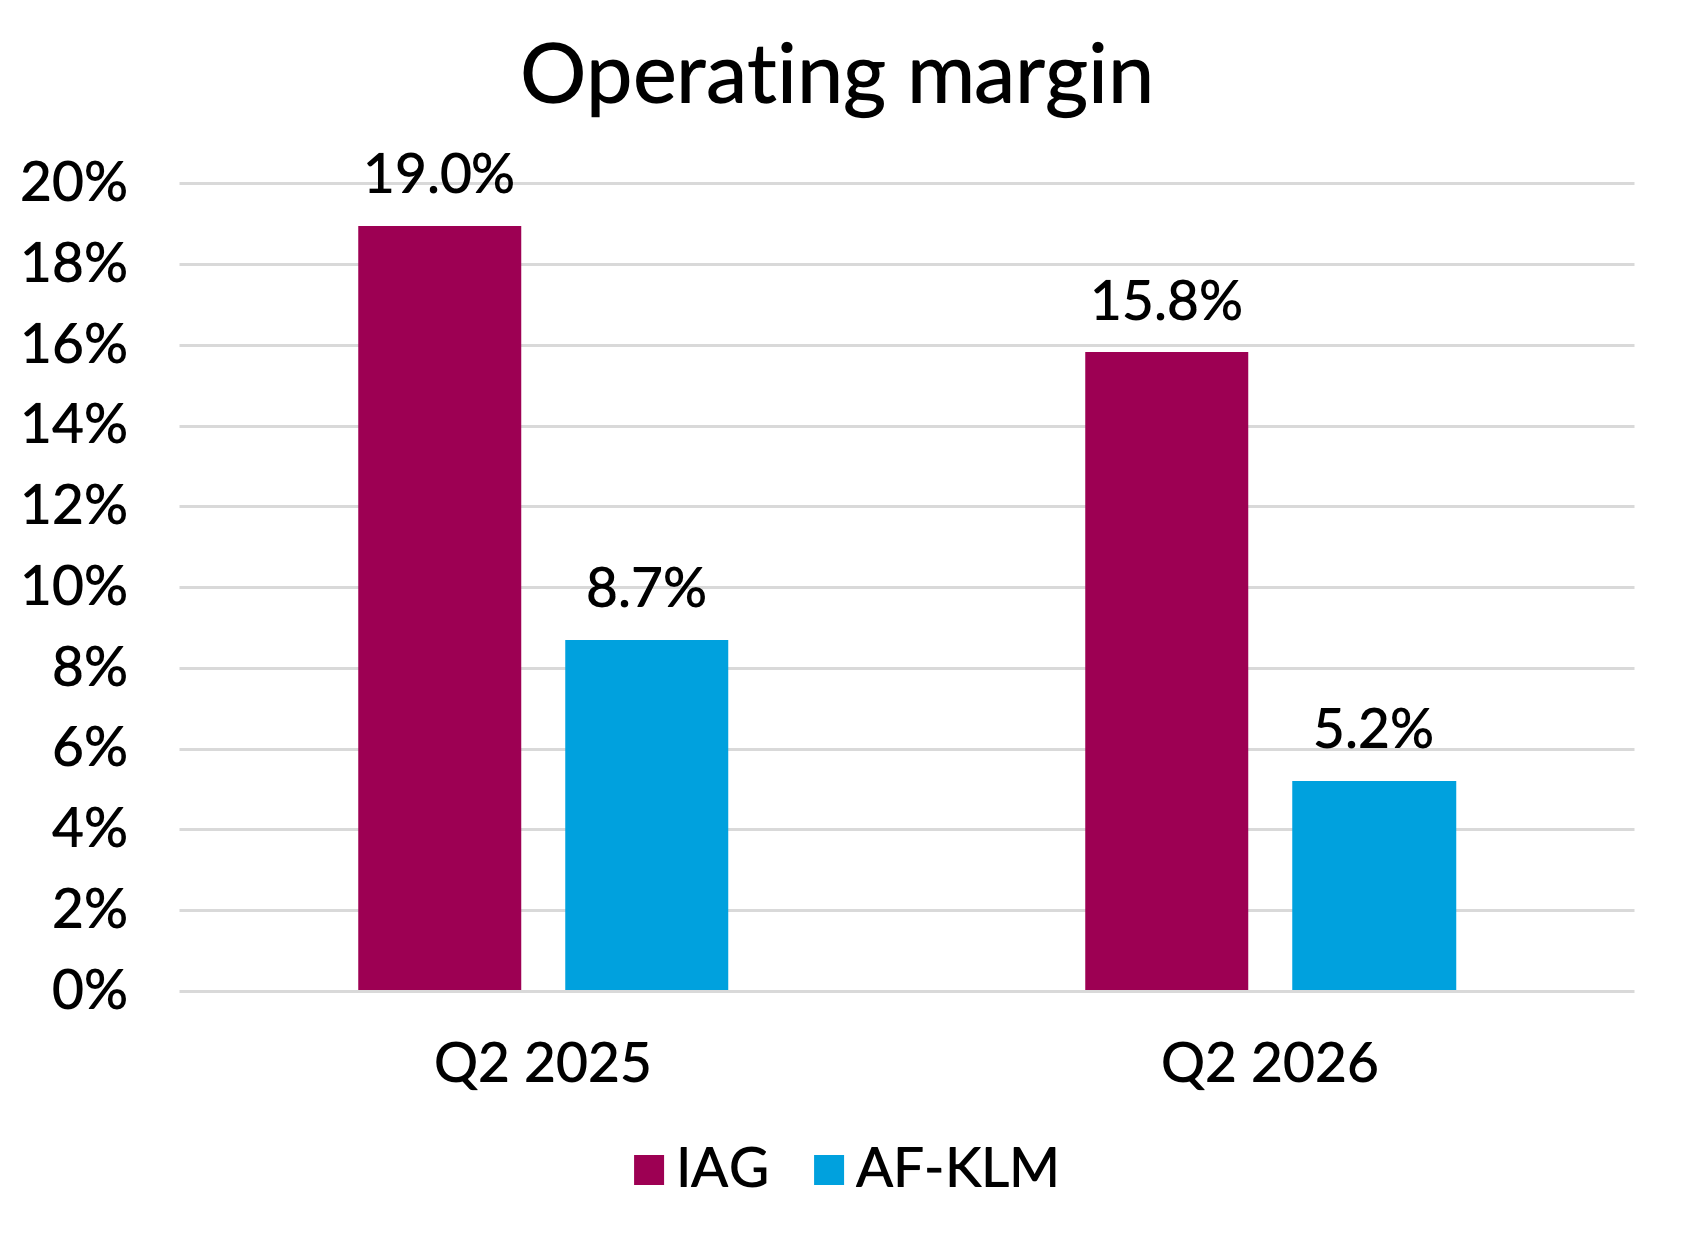
Source: Company reports. AF-KLM operating profit is “adjusted operating profit”. IAG’s excludes exceptional costs.
The differences were much more striking when you look at the composition of the overall profit performance. Despite the very similar margin changes, AF-KLM did much better on revenue, and IAG did much better on costs. Let’s start with the cost story.
Non-fuel operating costs
IAG's 1.7% drop in non-fuel unit costs was 4.3 points better than AF-KLM's 2.6% increase, a performance difference which looks all the bigger given that AF-KLM grew by 2.6% whilst IAG shrank by 0.5%.
We know that IAG’s non-fuel unit cost improvement was essentially all currency related. The euro strengthened against both the dollar (2.6%) and sterling (2.0%) compared to Q2 2025. Nevertheless, flat costs excluding currency effects is still a pretty reasonable performance.
AF-KLM’s numbers were also flattered by currency effects, but the company doesn’t give us all the information we need to calculate exactly how much. The effect probably wasn’t as big as at IAG, since AF-KLM lacks the sterling cost base that BA provides to IAG. So on a constant currency basis the performance gap would narrow a bit, but still be significant.
AF-KLM has its own preferred unit cost metric, which looks at total cost including fuel, with other revenue netted off. With fuel price and exchange rates held constant, that metric increased by only 1.0%. But as we’ll see later, that benefited from a €120m improvement in other revenue. Some of that might have come with non-ASK-related cost increases, such as the €53m growth in third-party MRO revenues. But overall it does seem odd to classify this revenue growth as reducing unit costs.
Fuel costs
There was more of a difference than I was expecting on fuel costs. On a per-ASK basis, fuel costs at IAG rose by “only” 23.4%, compared to a whopping 41.8% at AF-KLM, representing an increase versus last year of a cool €764m. That’s quite a chunk of change for a single quarter. The increase at IAG was €413m. Still painful, but the two airline groups use about the same amount of fuel, so that’s a big difference.
As you would imagine, the differential performance here is all down to fuel price paid, net of hedging. On the following chart, I’ve shown the average price per tonne of fuel each group paid in Q2 and how that compared to last year. I’ve included the cost of the SAF premium in my figures because although AF-KLM discloses those numbers, IAG does not. I have excluded emissions costs in both cases. The 27% increase in IAG’s price compared to 49% for AF-KLM’s explains most of the difference in fuel cost performance.
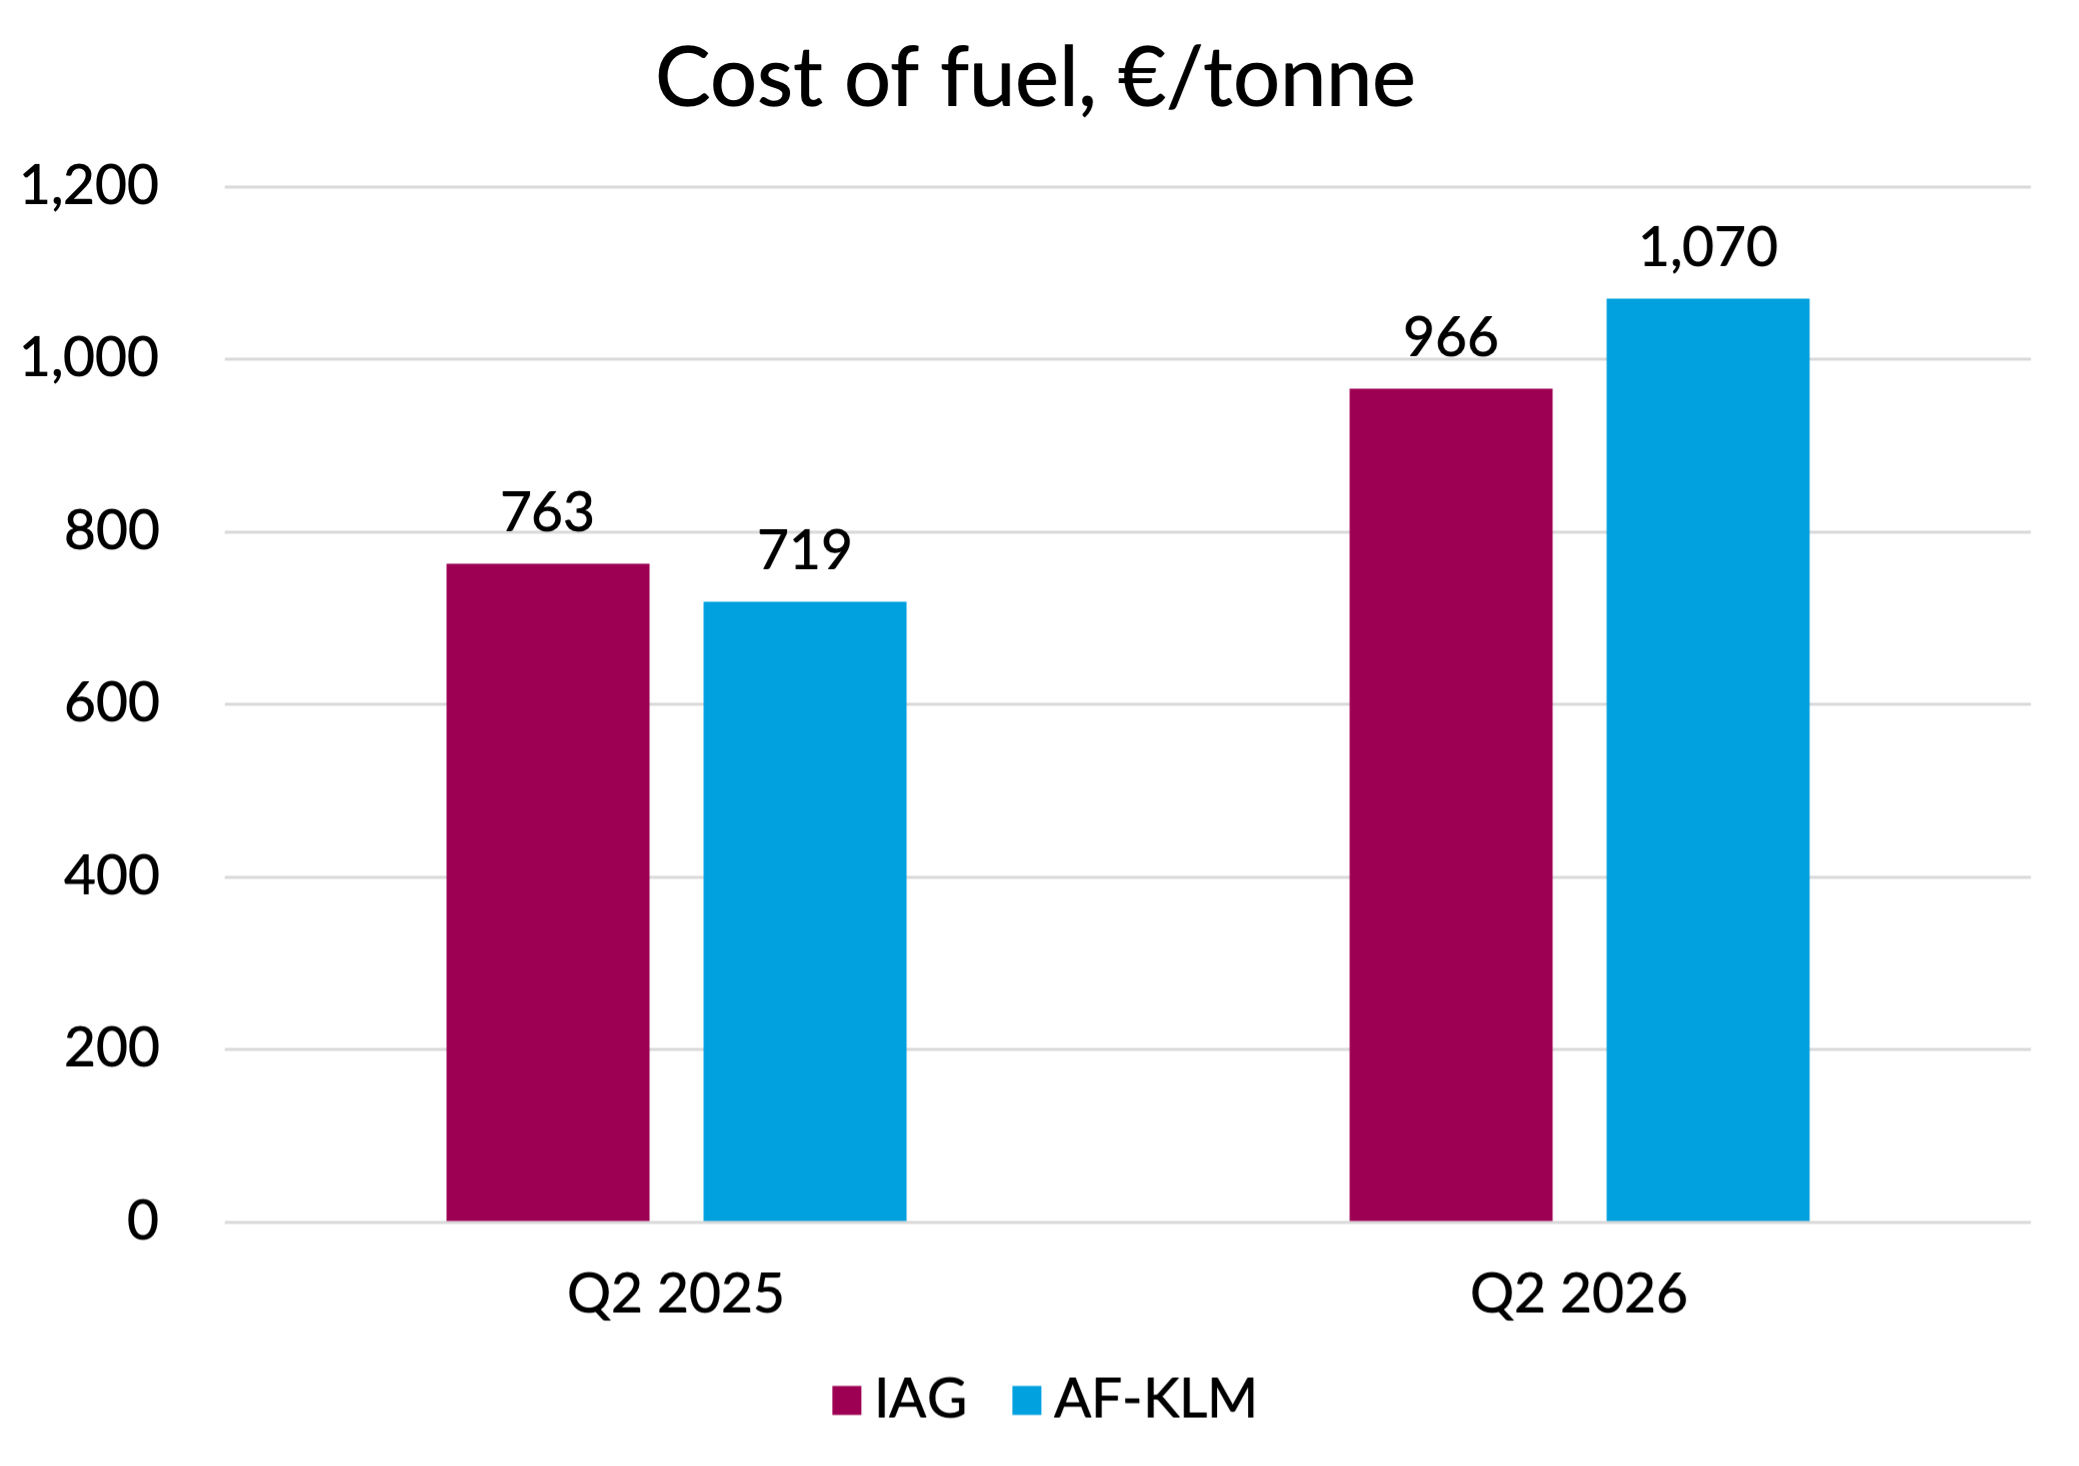
Source: Company reports, GridPoint fuel volume estimates for IAG
You can see from the above chart that part of the reason for AF-KLM’s higher fuel cost increase is a base year effect - AF-KLM achieved 5.8% lower prices than IAG last year. But most of the difference is due to AF-KLM paying 10.8% higher prices this year.
The difference is quite surprising because, on the face of it, both groups were quite similarly hedged going into the recent fuel price spike. When I did the analysis for my earlier article on the likely effects of the Iran war on airlines, I estimated a post-hedging price in Q2 of €868 per tonne for IAG and €857 for AF-KLM. Very similar and if anything in favour of AF-KLM.
We see of course that the actual outturn prices have been higher at both airline groups than my earlier estimates. I acknowledged in that article that my estimates were certain to prove too optimistic, because not all the fuel price hedging would be against the jet price itself. A portion of the hedging portfolio would be marked against the crude oil price, which wouldn’t protect against the huge widening of the “crack spread” that we’ve seen. Neither IAG nor AF-KLM disclose the mix of their hedging portfolio, so I couldn’t allow for this explicitly. Lufthansa did disclose their mix, and I estimated that this would reduce their hedging benefit by 40%.
Based on the now disclosed fuel cost data, it looks like AF-KLM’s hedging has proven to be quite ineffective at protecting against the increase in the jet fuel price. Instead of an estimated €900m benefit in Q2 that I calculated, they achieved €484m - only 54% of the benefit they would have achieved if their hedges had been against the jet fuel price itself.
I think IAG got closer, but unfortunately the company doesn’t disclose quarterly hedging profit figures, only giving us a hedging benefit for H1 in total of €769m. AF-KLM’s total for the half was €643m, so IAG definitely did better over the whole period, but the difference in the Q2 cost figures suggests IAG’s hedging benefit was also a bit more skewed towards the second quarter.
In any event, the net result was that IAG’s fuel cost per tonne was about 10% lower in the quarter than AF-KLM’s. For a cost line that now makes up around 25% of revenue, that’s quite material in terms of the impact on margins.
Revenue
Big differences also emerge when looking at revenue performance. AF-KLM's total revenue grew by 9.9%, whilst IAG's barely increased at all (up 0.2%). In total, AF-KLM added €834m of revenue whilst IAG managed a measly €21m. You can see from the following chart that the bulk of this difference came from passenger revenue, as you might expect. We’ll do a deep dive on that in the next section. But cargo revenues were also a significant contributor to AF-KLM’s better performance, growing by 25.7% as the company took advantage of the loss of capacity from Middle East competitors. IAG was unable to do the same, with cargo revenues falling by 5.1% driven by its Middle East cancellations.
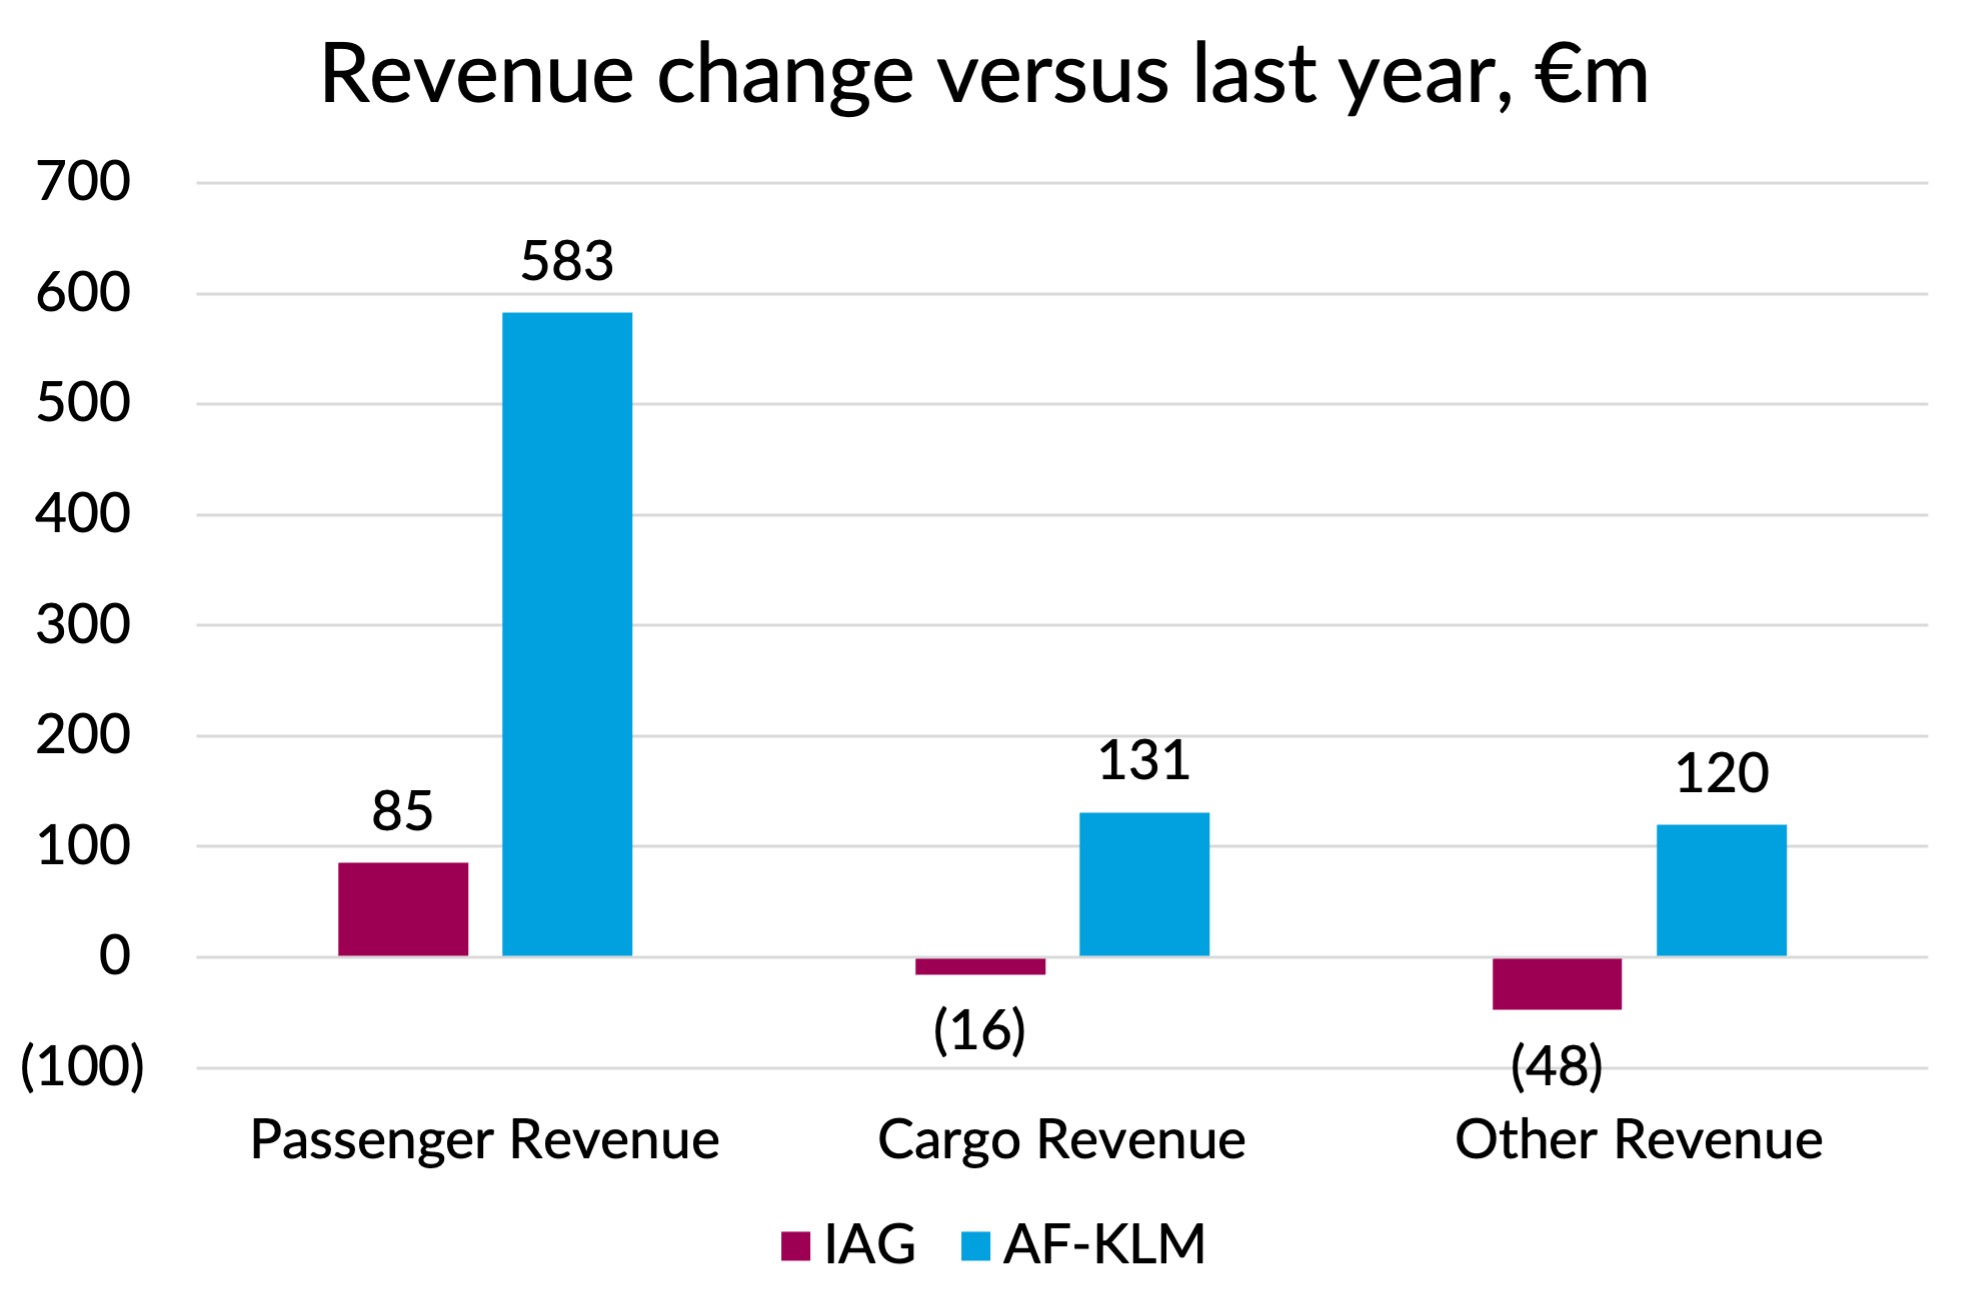
Source: Company reports, GridPoint analysis
“Other revenue” was also a big source of divergent performance. Some of IAG’s €48m reduction came from a change of contracting arrangements at Iberia’s MRO business, where certain supplier costs that used to pass through Iberia’s accounts are now supplied direct to its customers, reducing revenue and costs in equal measure. Adjusting for that would reduce the revenue performance gap a bit, but would also trim the size of IAG’s outperformance on unit costs.
Without further ado, it is time to dig into the almost €500m performance difference in passenger revenue. Let’s start with capacity.
Capacity
As we’ve already noted, capacity growth explains part of the passenger revenue performance gap, with AF-KLM’s ASKs up 2.6% whilst IAG’s were down by 0.5%.
Both groups have cut capacity since the war broke out, but IAG have cut more aggressively. Before the war, IAG were indicating 3% capacity growth for 2026 and they have now cut those plans to zero. AF-KLM’s pre-war guidance was higher than IAG’s at 3-5%, and although they’ve now trimmed that to 2-3%, that’s less of a cut than at IAG.
For the analysis which will follow on regional unit revenue performance, I’ve had to group some of the regions together to get a set for which both carriers report revenue data. Unfortunately I’ve had to aggregate Africa, Middle East & Asia, because IAG groups the Middle East in with Africa and South Asia, whilst AF-KLM groups it with the whole of Asia. So before we start looking at the data on that basis, I’ll first show you how capacity changed for the specific subregions. The charts below show the amount of capacity each deployed last year in Q2 and the percentage change in capacity for Q2 this year. You can see that despite the fact that the growth rates of the individual subregions weren’t that different, the impact on the growth rate of the broader region of effectively deleting the Middle East was much bigger at IAG. That’s essentially because the Middle East represented a much bigger share of the capacity of the broader region for IAG.
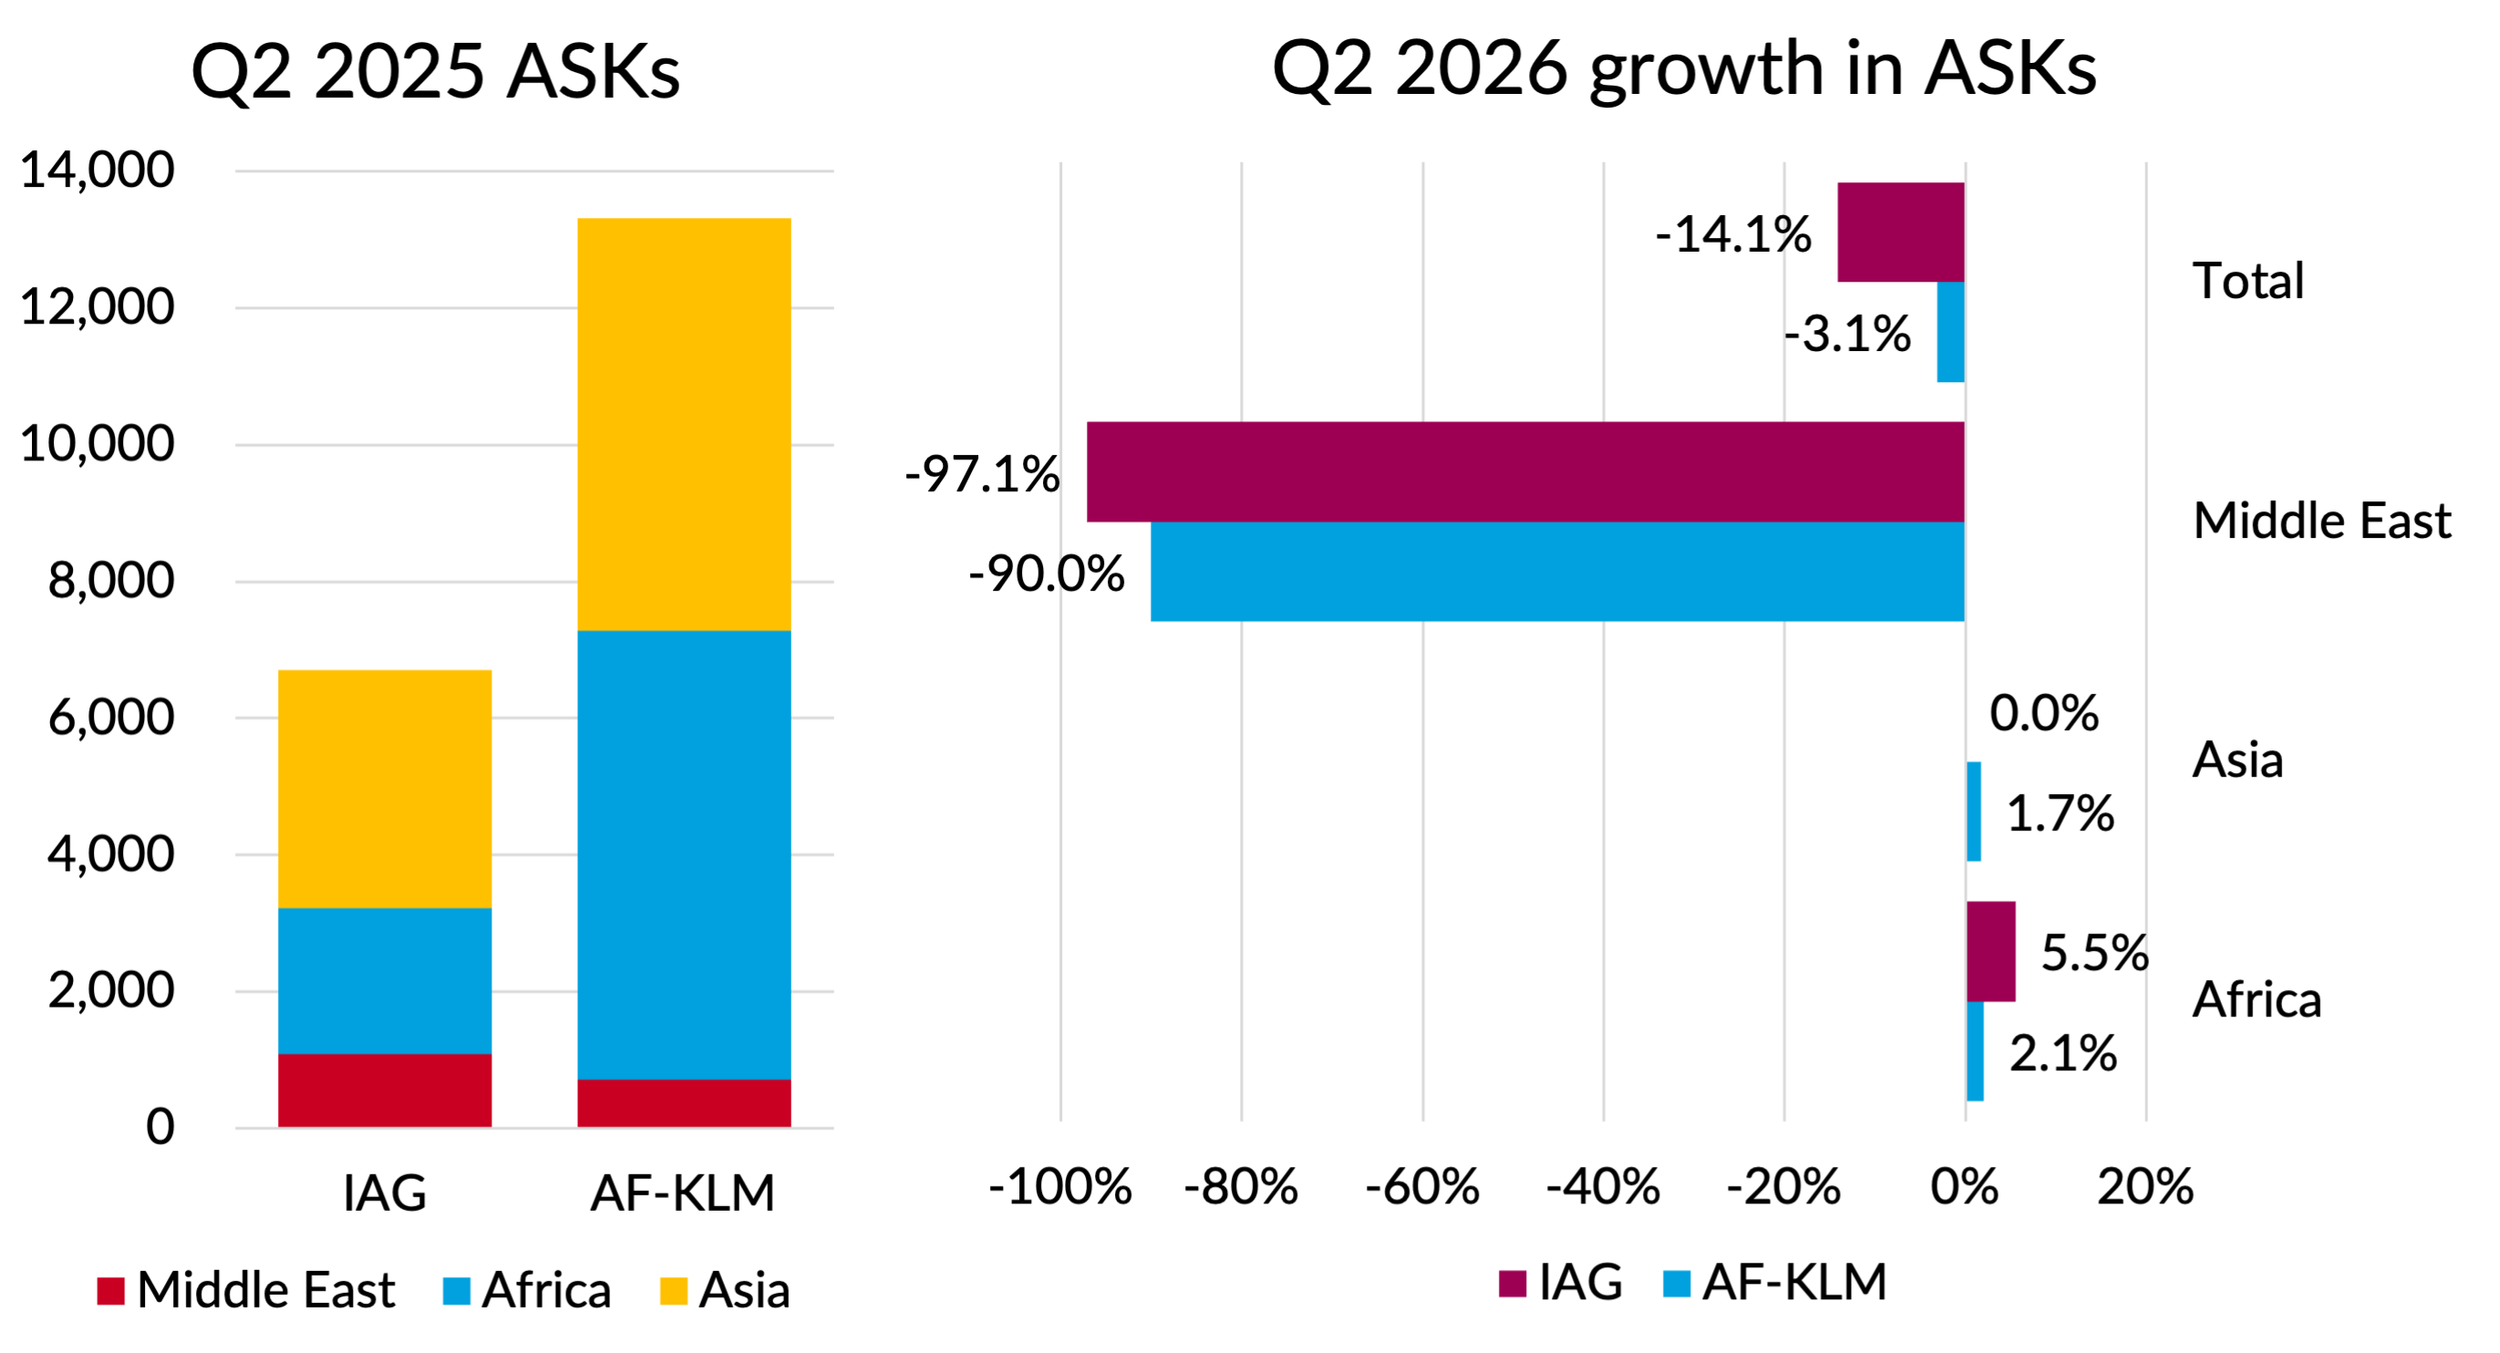
Source: Published schedules, GridPoint analysis
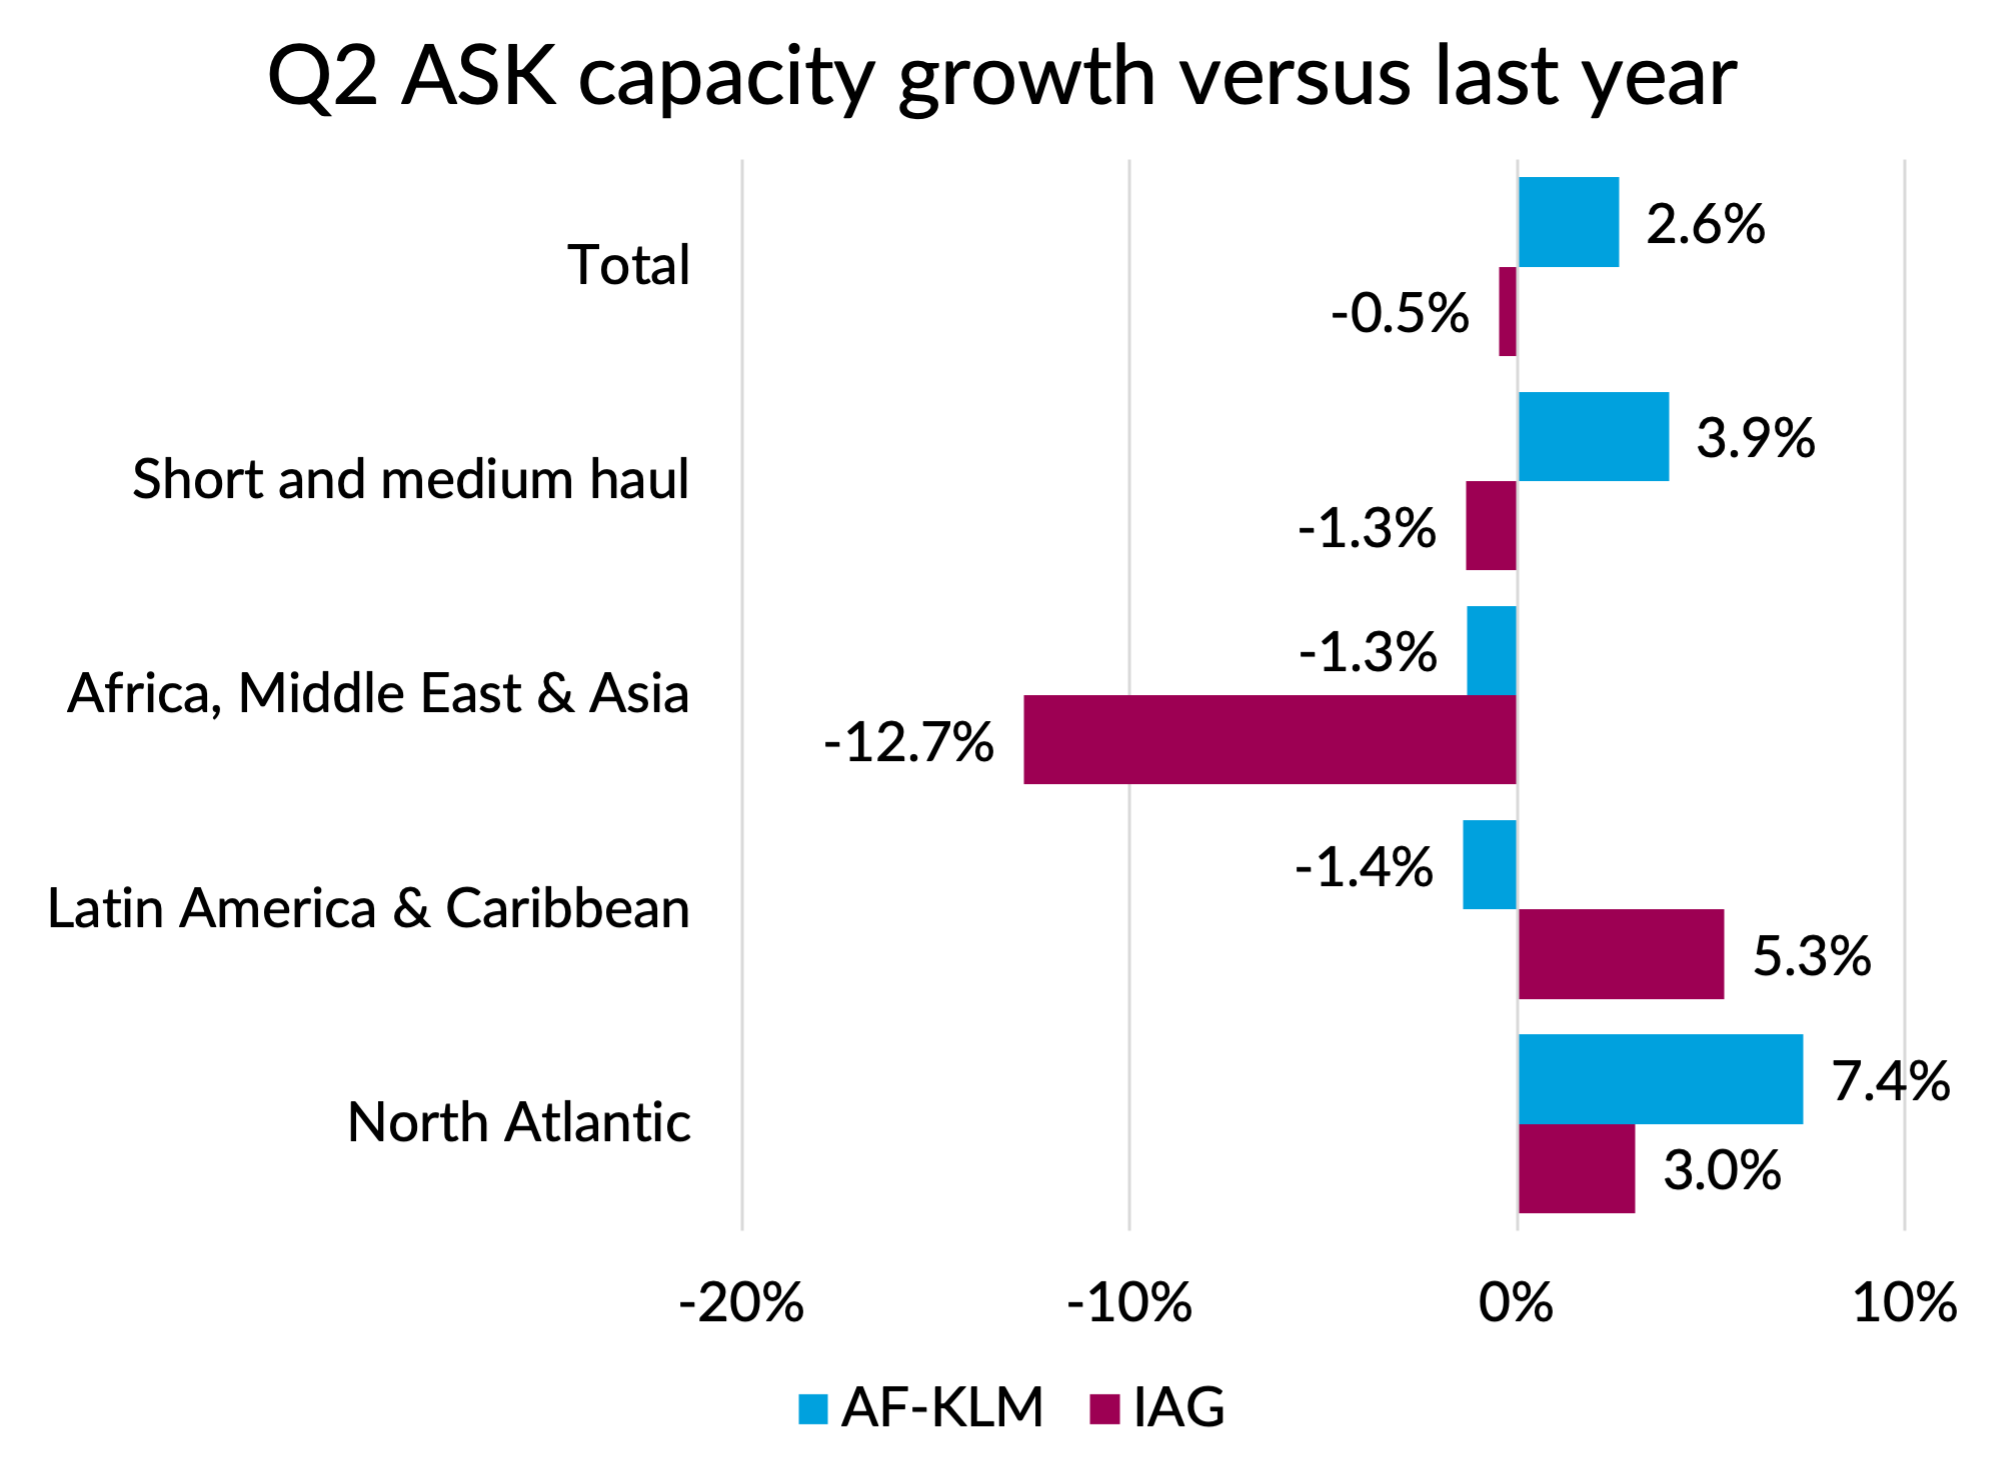
On the next chart I’m showing capacity growth rates for all the regions. This data is sourced from company reports, which give slightly different numbers from the preceding chart, which is based on published schedules. But hopefully you will now understand why there was such a big difference between the two groups for the Africa, Middle East & Asia region.
Other things to note are the higher growth rates for AF-KLM in short and medium haul and on the North Atlantic. There is only one area where IAG outgrew AF-KLM and that was Latin America and the Caribbean.
Source: Company reports, GridPoint Analysis
Unit passenger revenue performance
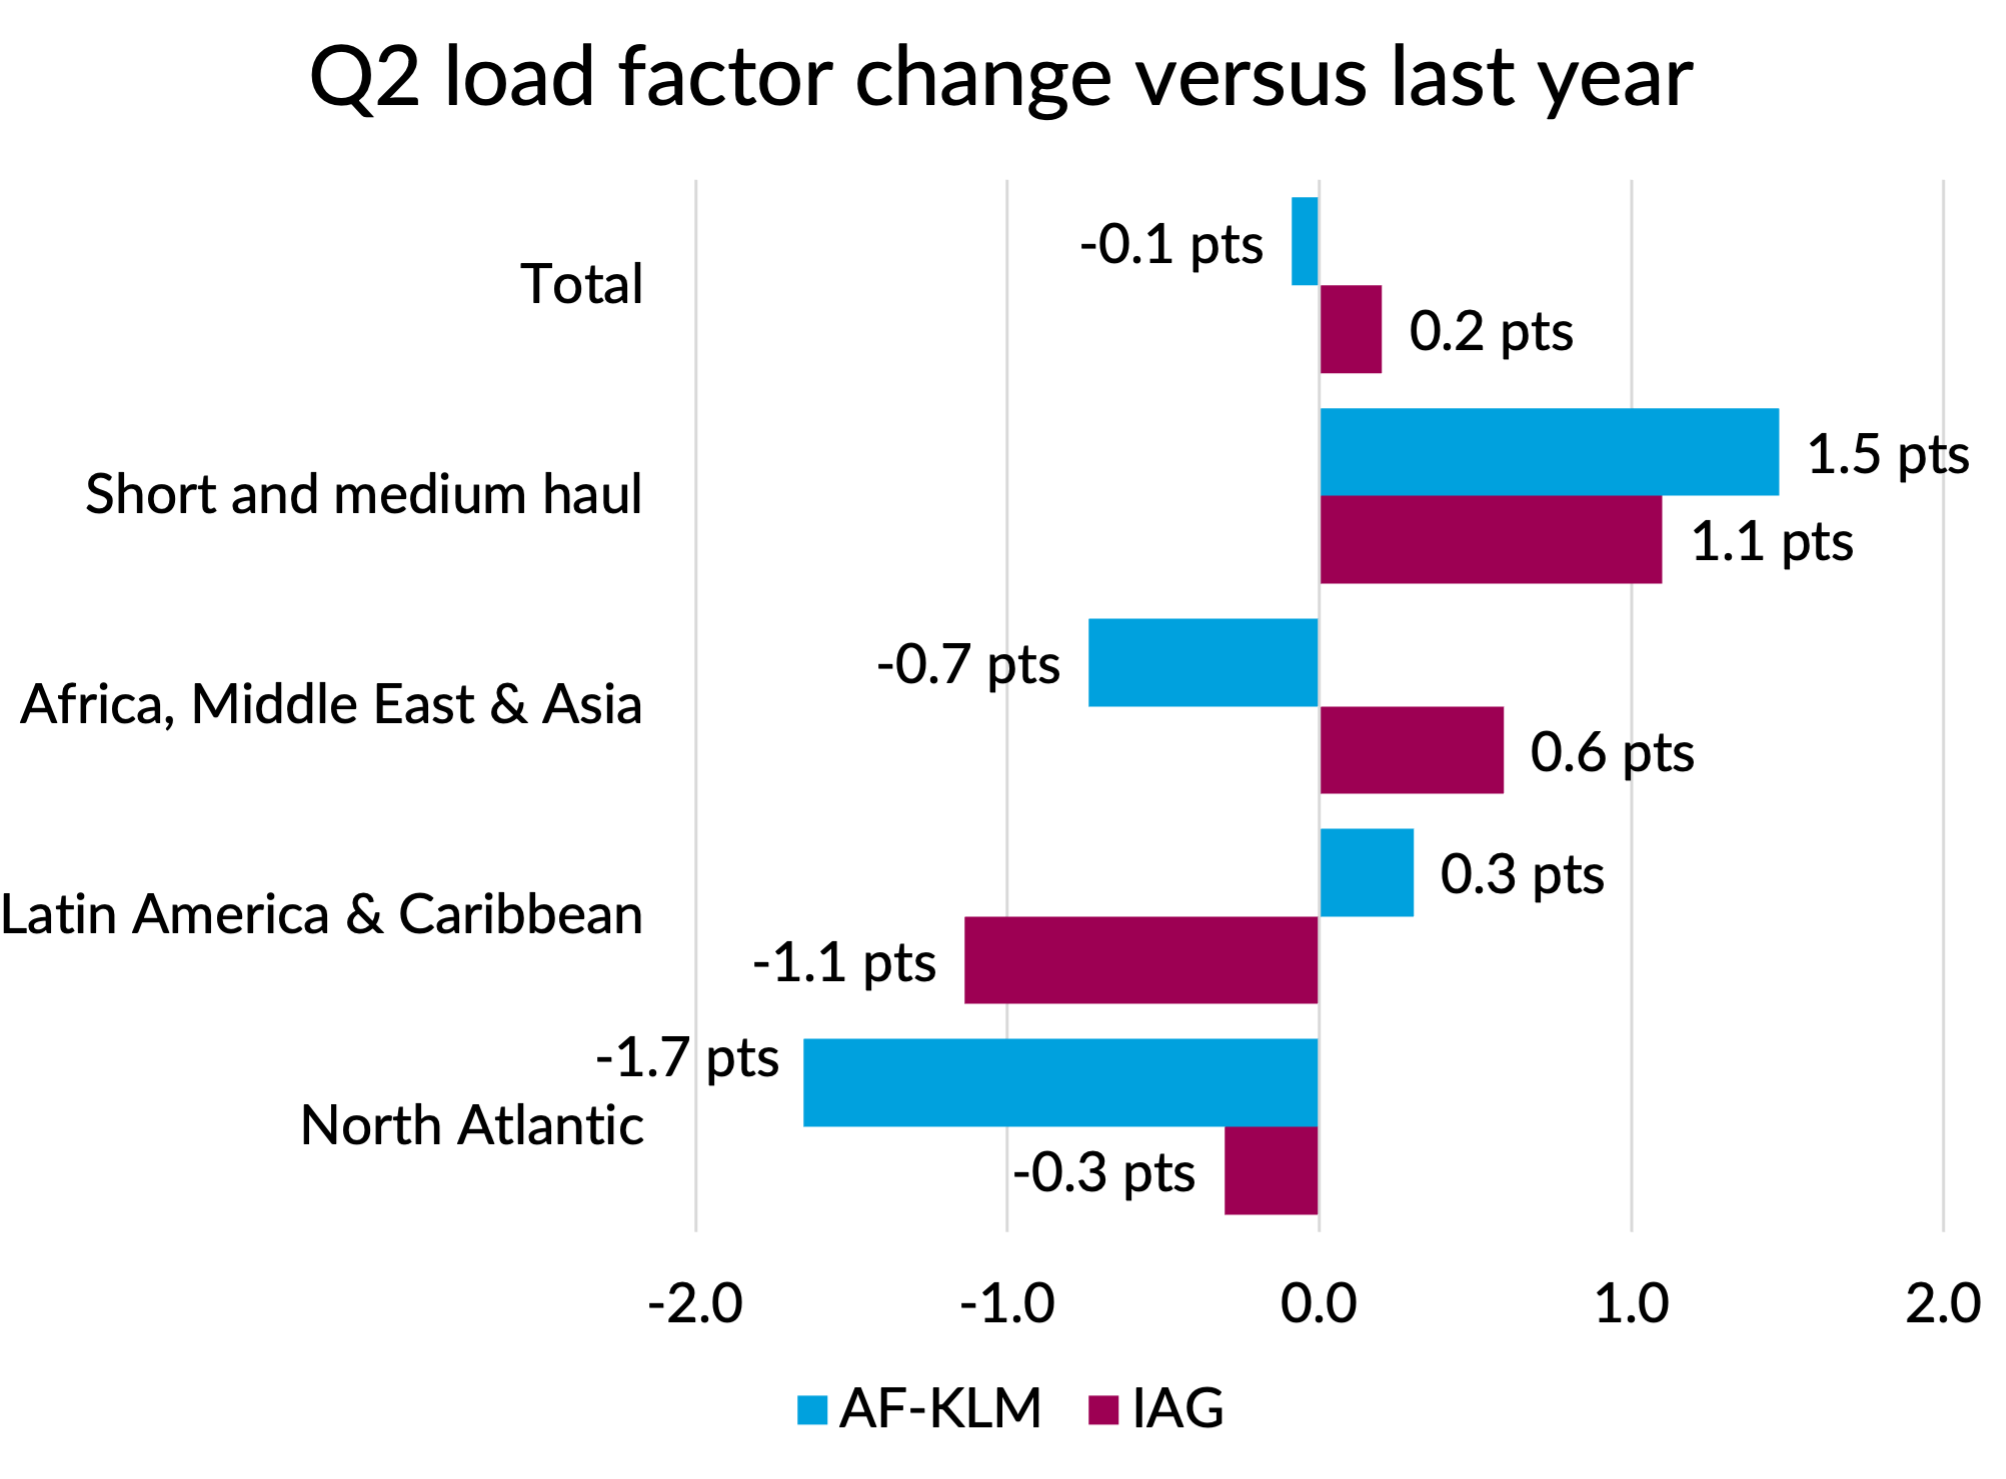
Overall load factors were pretty flat compared to last year in both cases, with IAG slightly outperforming, presumably in part due to lower capacity growth. However, faster growth in short and medium haul at AF-KLM didn’t do any noticeable damage to its load factors, perhaps because it consolidated all flying at Orly into its low-cost unit Transavia. IAG’s faster growth in Latin America and the Caribbean did seem to do some harm to its load factor, which fell by 1.1 points.
Source: Company reports, GridPoint analysis
Load factors by themselves don’t tell you much about demand or revenue performance. Modern revenue management systems are more than capable of “dialling in” any load factor target you want to hit, so long as you are willing to live with the fares required to do so. A much more interesting metric is “revenue per ASK” or RASK. That captures both the load factor and the average fare elements.
Both groups publish some regional splits of their unit revenue performance. IAG publishes RASK change by region, on both an outturn and a constant currency basis. AF-KLM’s management commentary on its results gives some figures for yield changes by region, and they also publish revenue data split by region. Unfortunately, they are not exactly the same regions for which it publishes capacity data. The amalgamation of regions required to allow for this and to compare performance between the two groups requires some approximations. Where all we have is the RASK growth and the capacity, we don’t have quite enough information to exactly calculate the amalgamated RASK growth. But the errors that come from weighting by ASKs should be small.
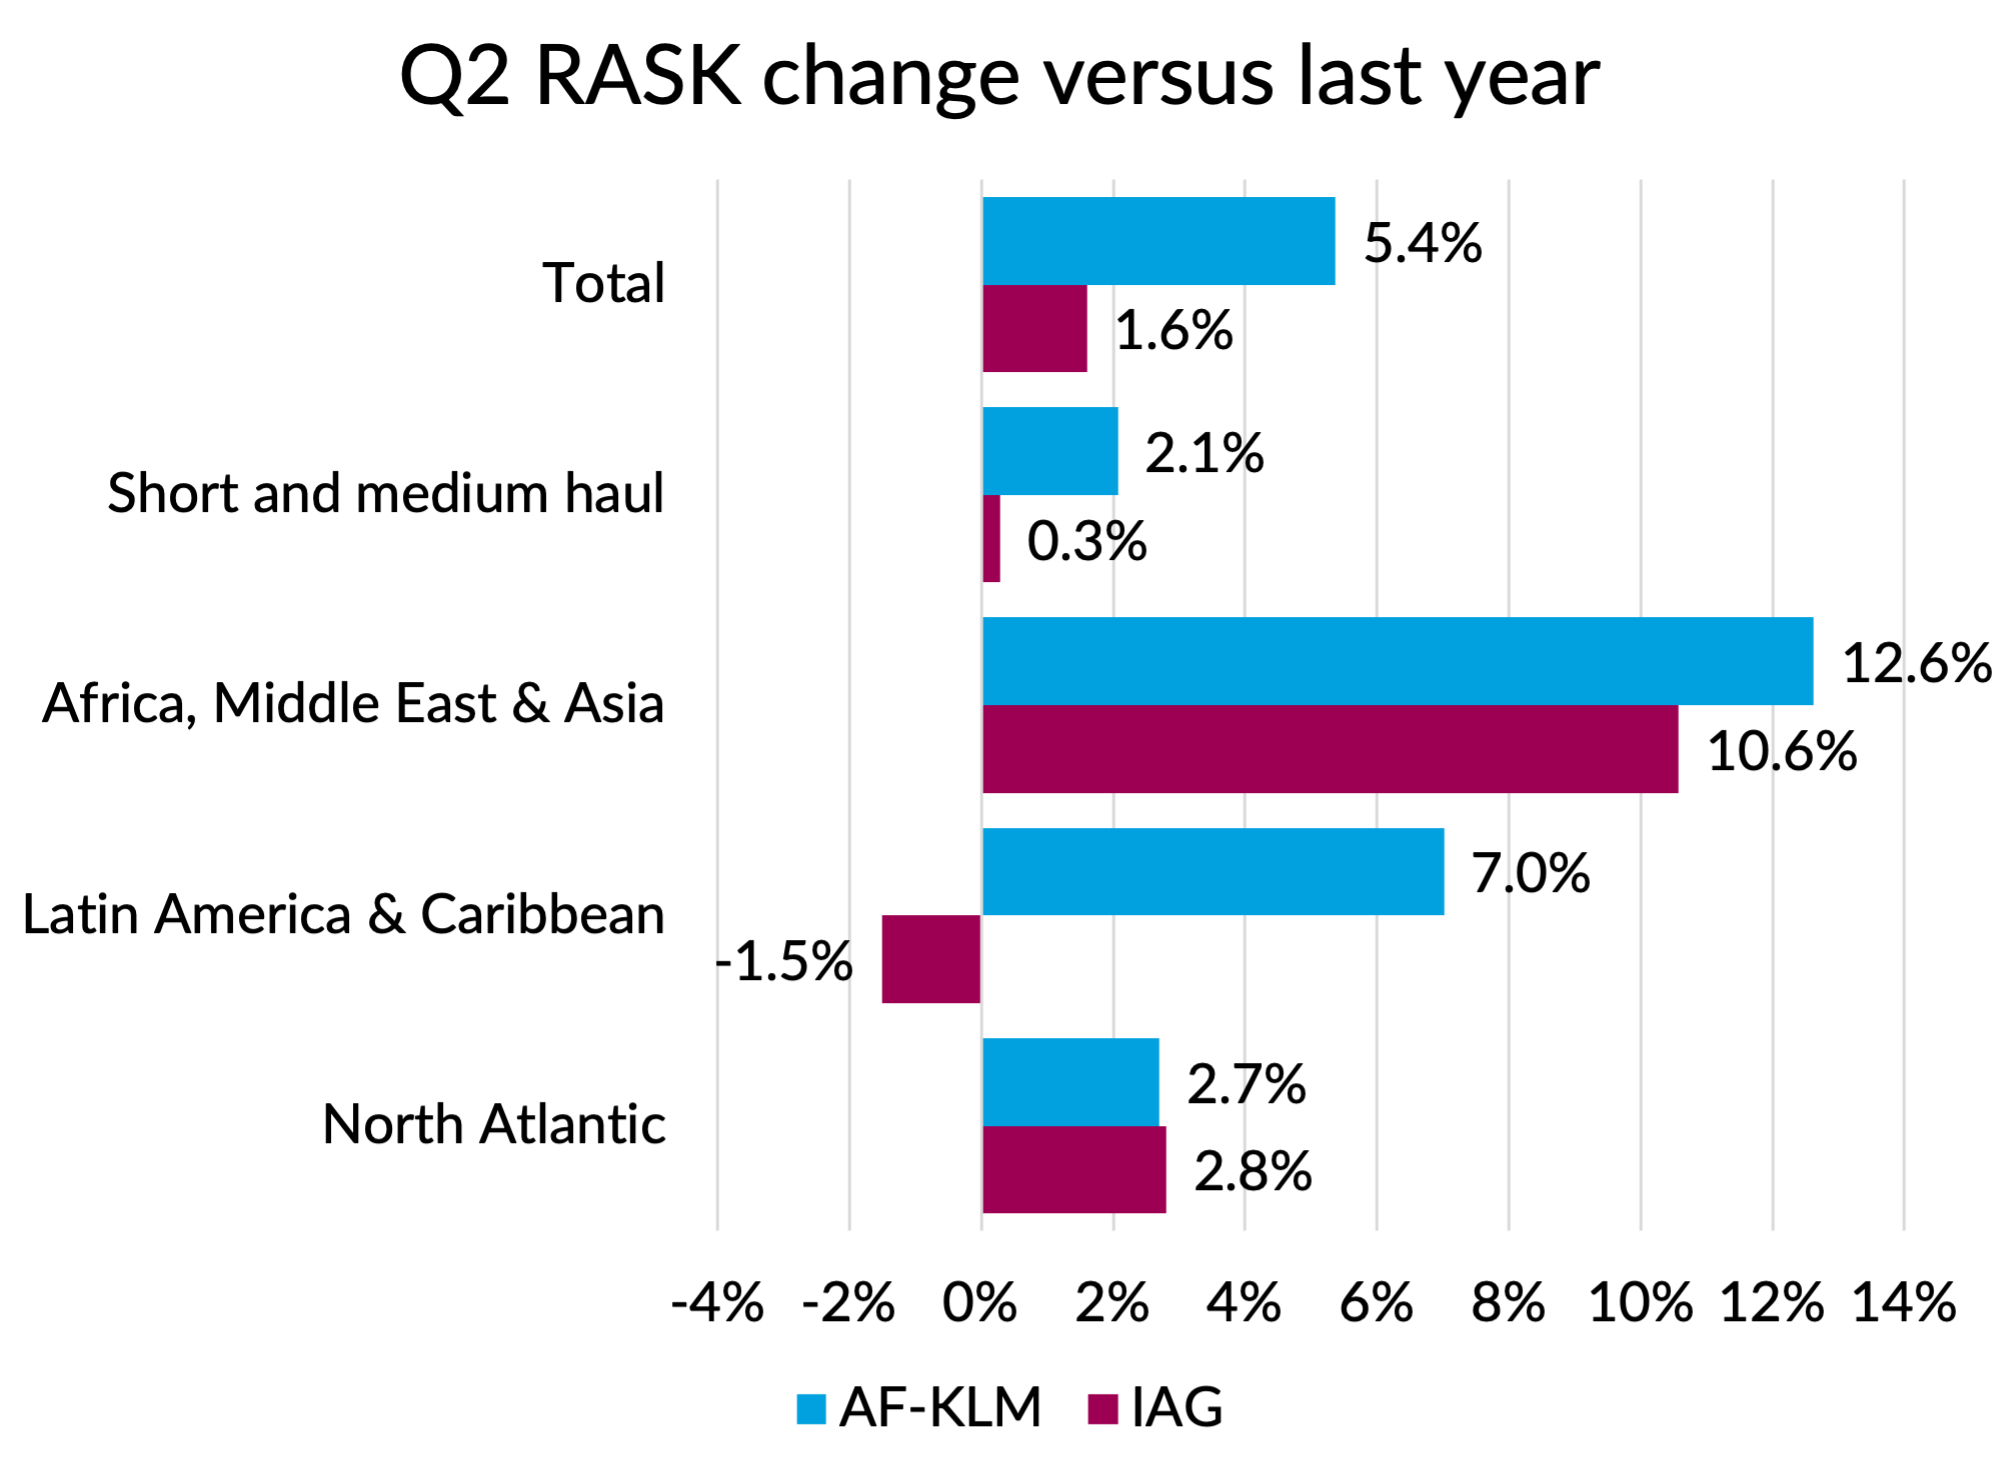
With those caveats out of the way, here is the comparison of RASK change in Q2 compared to last year, cut by region. AF-KLM’s overall outperformance looks like it is coming across the board, with the one exception of the North Atlantic where performance looks almost identical. IAG’s better load factor performance was almost exactly offset by yield. Also noteworthy is the difference on Latin America & Caribbean. Some of that difference is currency driven, as we’ll see in a minute, but overall the IAG performance looks quite poor. It is also striking how much better unit revenues were on AF-KLM’s short and medium haul network, despite the faster growth.
Source: Company reports, GridPoint analysis and estimates.
As well as the differences in performance by region, AF-KLM’s overall RASK performance benefited from having a higher exposure to strongly performing regions like Asia and less exposure to poorly performing ones like short and medium haul. I estimate that this contributed about 0.7 points in AF-KLM’s favour to the group level RASK comparison.
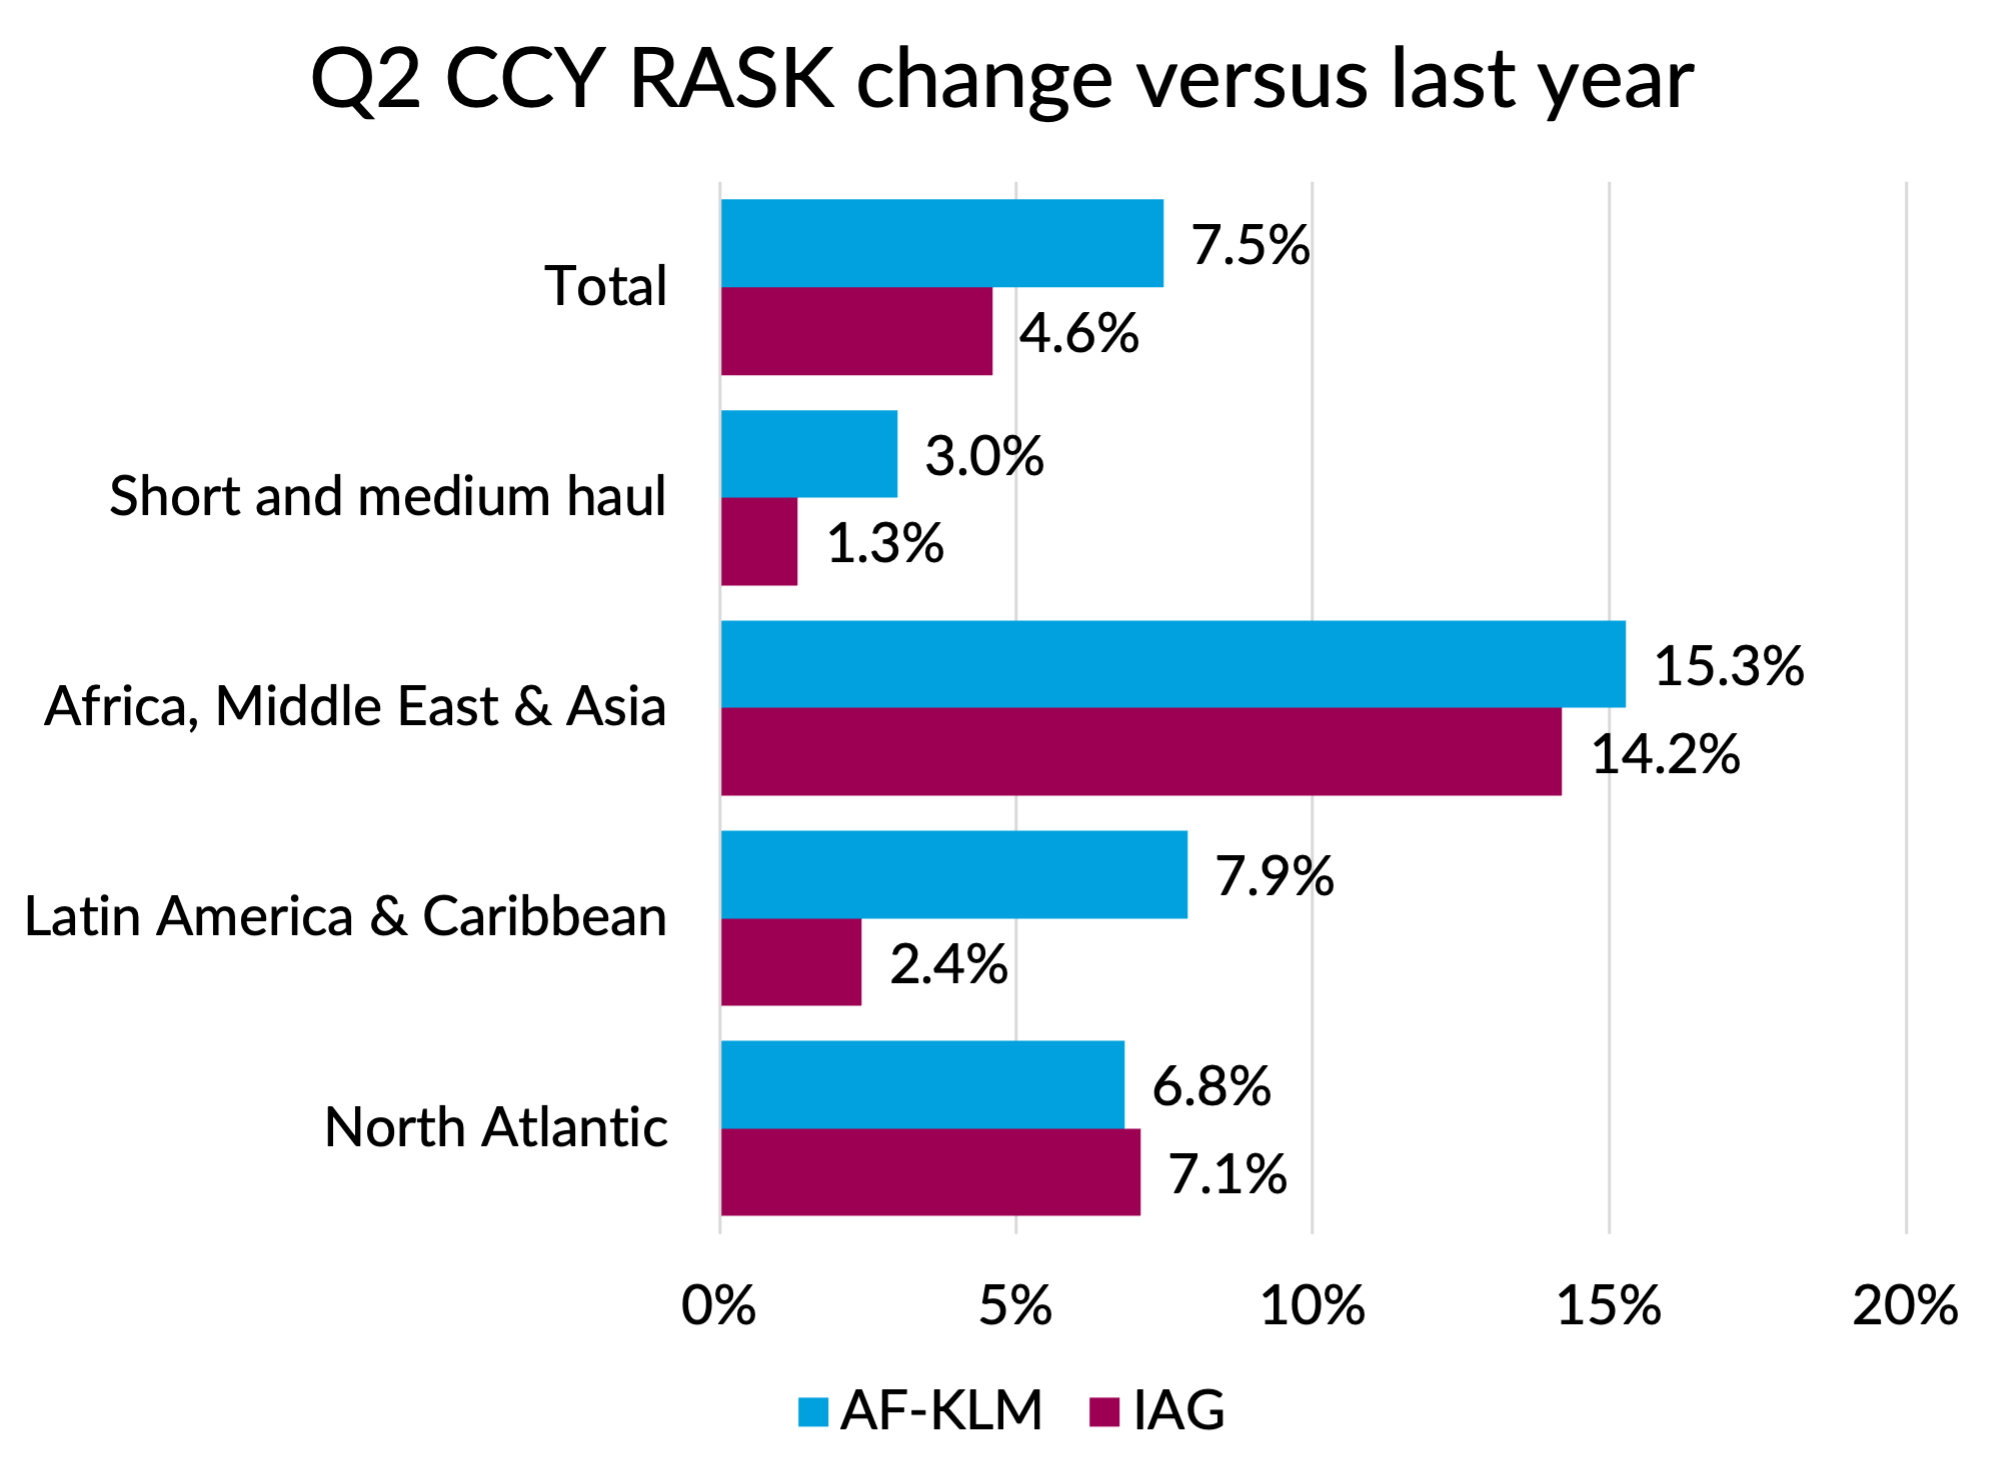
As I mentioned earlier, currency effects were quite material in the quarter, so I’m going to attempt to show the figures on a constant currency basis. I’m afraid this comes with a couple more caveats. I’m relying on the regional yield changes given in AF-KLM’s management commentary, which it doesn’t explicitly say are on a constant currency basis. But I’m pretty sure they are - we can calculate the outturn currency numbers directly from their revenue and capacity data for regions like the North Atlantic, and you don’t get the same figures as in the commentary. They also refer to the North Atlantic performance as a “unit revenue” change, which could theoretically mean RASK. But the numbers make more sense if it is a yield change, which is what I’ve assumed. The figures for the other regions are explicitly labelled as yield. Finally, AF-KLM don’t provide constant currency data for their short and medium haul network. They do provide an overall figure for the network airlines, so we can triangulate a constant currency figure for the network airline part of short and medium haul. But I’ve had to assume that there were no currency effects for Transavia’s unit revenue performance. As a largely point-to-point airline operating in Europe, that should be a reasonable assumption.
OK, sorry about the long preamble. Let’s get to the chart. You can see that even on a constant currency basis, AF-KLM strongly outperformed IAG when it came to unit revenues (7.5% versus 4.6%), with Latin America & Caribbean and short and medium haul the biggest sources of outperformance. Whichever way you look at it, AF-KLM did a much better job on revenue.
Source: Company reports, GridPoint analysis and estimates
Are higher fuel prices being passed on in prices?
On the evidence of the Q2 performance of these two airline groups, it doesn’t look to me like higher fuel costs are being passed through to customers in short and medium haul. Certainly not enough to protect margins. Ryanair’s Q2 results showed the same thing, with revenue per passenger down 5%. Unit revenues were down too at easyJet, with RASK falling by 3%.
There is a bit more evidence of pass-through on the North Atlantic. RASK improvements of 7% on a constant currency basis would offset about half of the average increase in spot fuel prices during the quarter. Perhaps the fact that the US carriers don’t hedge fuel had an effect. Certainly the US majors reported much bigger unit revenue increases for Q2, with 10% at American and 12% at United. Delta was also 12% on an adjusted basis.
Of course it takes time for higher costs to be passed on to customers and that’s one of the best arguments for hedging fuel costs to buy time for adjustments to prices and capacity to take place. But US carriers argue that hedging just makes carriers slow to make the necessary adjustments and the evidence from well-hedged European carriers in Q2 might lend support for that argument.
With fuel prices remaining stubbornly high, it seems to me that we will need to see more aggressive action on capacity heading into the winter season if profit margins are not going to take further hits as fuel hedging unwinds.