
Lufthansa reports Q2 results
Just as I was publishing my analysis comparing IAG and Air France-KLM’s Q2 results, Lufthansa reported theirs. In this follow-up post I will look at how well they did compared to their European peers. You should probably read my last post first, if you haven’t already done so, as I will build on some of the analysis I did there.
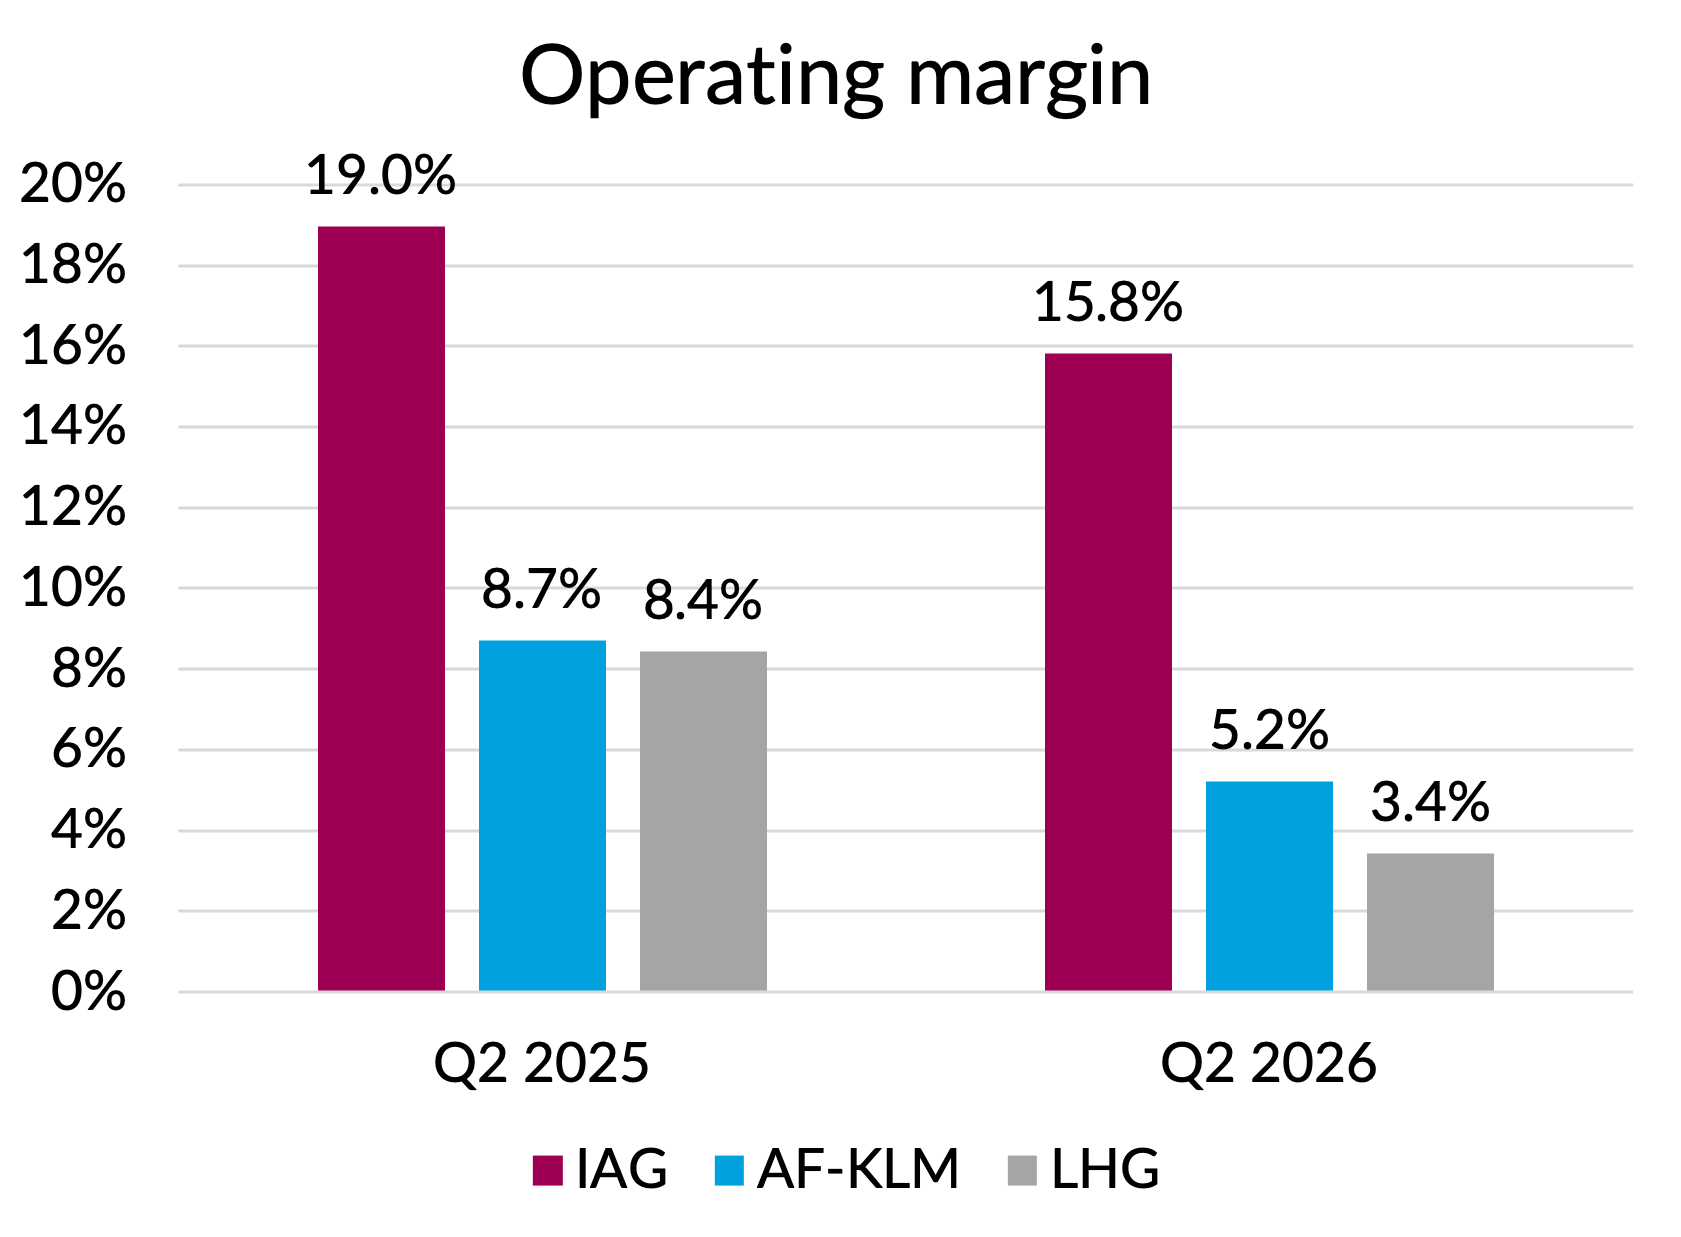
At a headline level, Lufthansa Group came in behind the other two, with an operating margin of only 3.4%, which was not only the worst absolute figure of the three, but also the biggest deterioration compared to last year (down 5 points versus 3.5 at AF-KLM and 3.2 at IAG). Granted, these results were strike-affected, with a €150m impact disclosed by the company. Without the strike, the margin would have been more like 4.7%, a 3.7 point deterioration compared to last year. Still the worst of the three, but much closer.
Source: Company reports
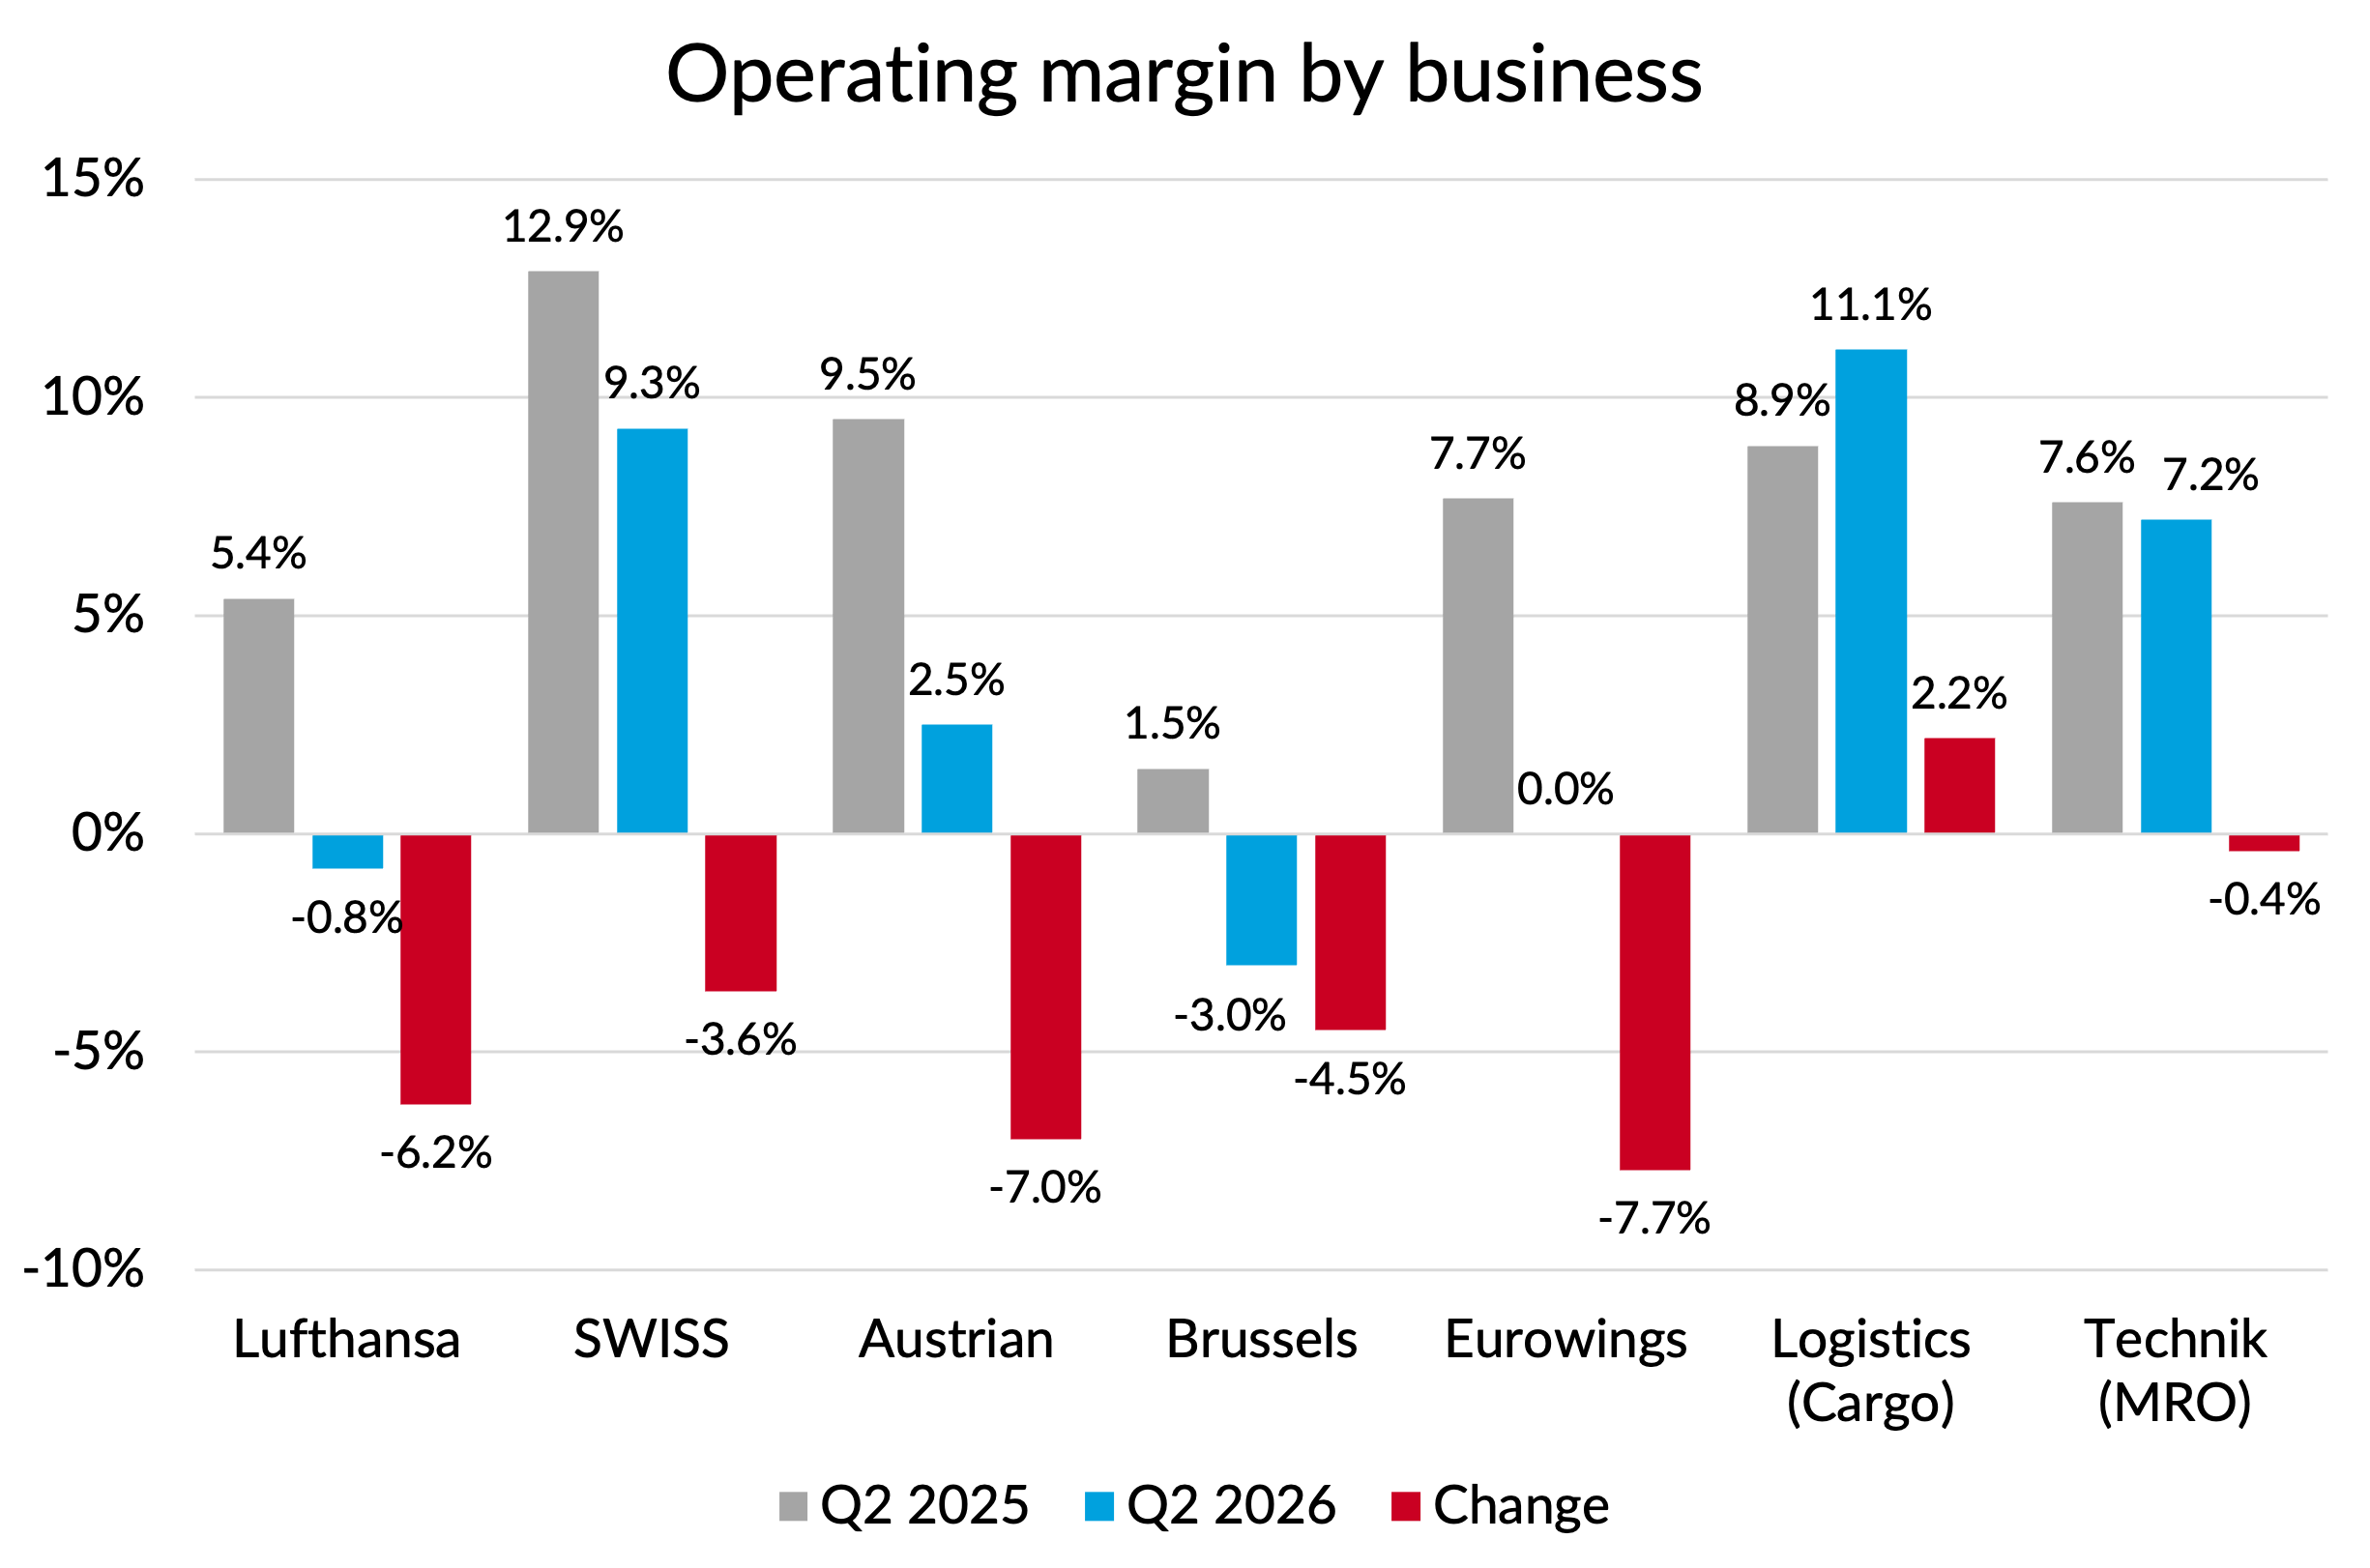
It is also worth pointing out that even this rather poor overall margin performance was propped up by strong results from Lufthansa Group’s large dedicated freighter business, with logistics profits up 58%. The MRO unit also helped boost overall group margins compared to last year. Whilst MRO margins slipped slightly, they were still above the group average and a 23% growth in third-party maintenance revenues meant that profits were up by 5%.
The core passenger businesses did really badly in general, and Eurowings was shockingly bad (margin down 7.7 points). The best performer as usual was SWISS, but I should point out that for some reason that’s the only airline within the Lufthansa Group that gets to keep its Cargo profits, of particular value this quarter given the strength of cargo revenues.
Source: Company reports
Fuel costs
The deterioration in airline profitability was of course mainly driven by higher fuel costs, as it was at AF-KLM and IAG.
At Lufthansa’s Q1 results briefing, they made a big thing about how well positioned they were compared to other airlines when it came to their fuel hedging position, being “80% hedged”, compared to 62% hedging at IAG and AF-KLM. As I suspected, the story is a bit more complicated than that because the price at which you are hedged matters too, and also the mix of hedging instruments (jet/gasoil/crude).
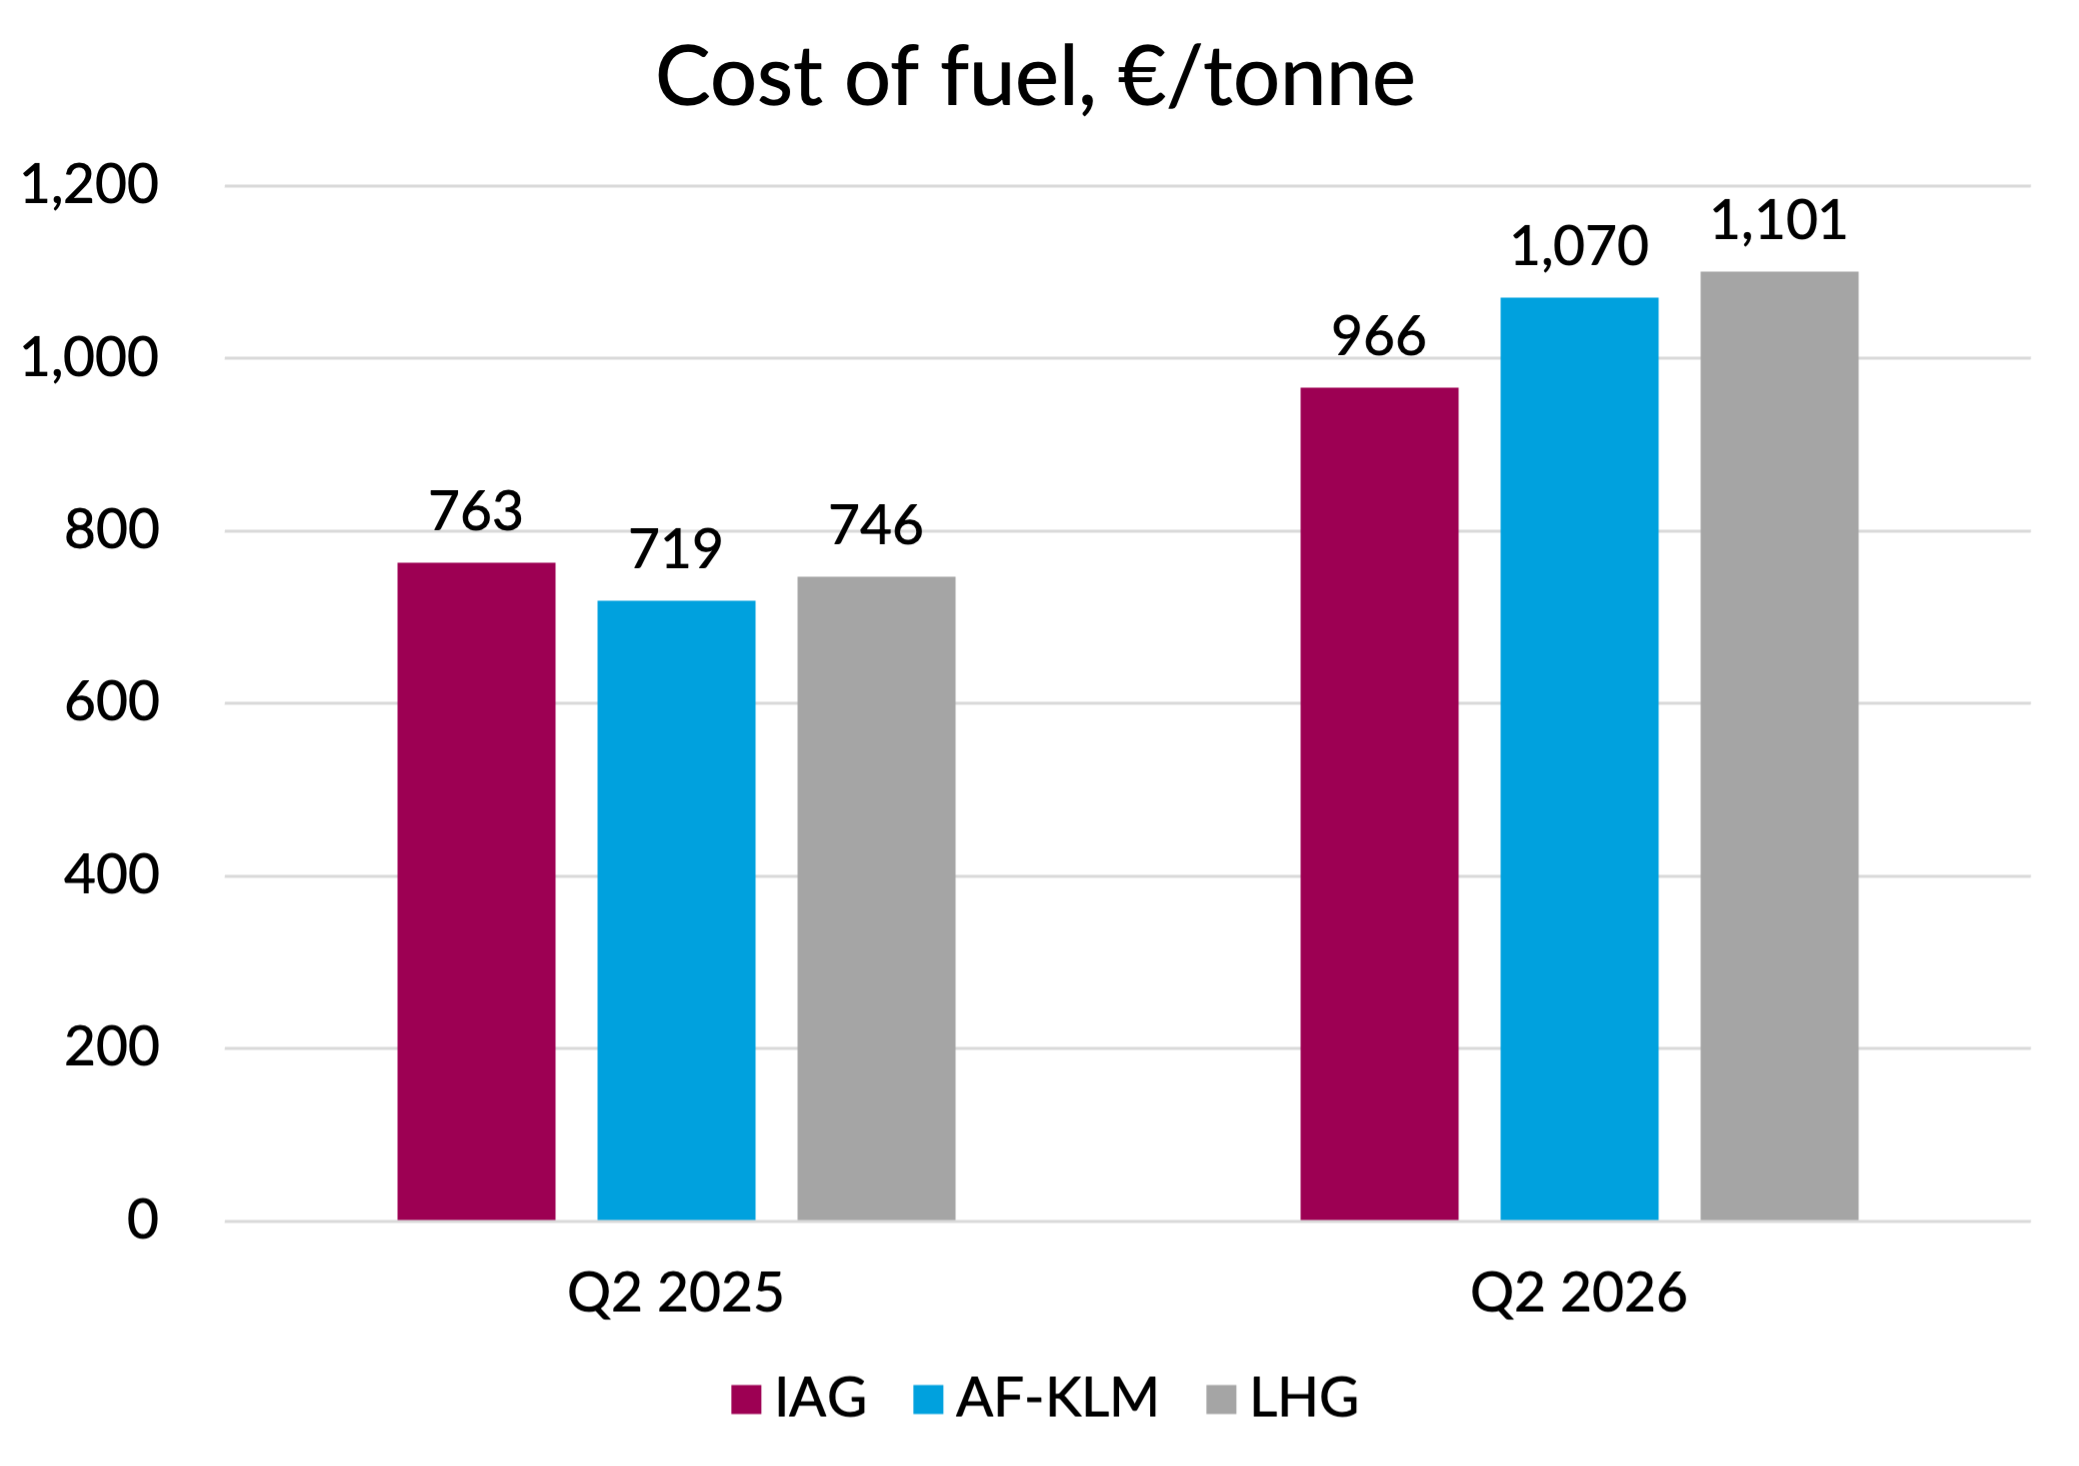
In my post on IAG and AF-KLM results, I showed a chart with my estimates of the price each group was paying for fuel in Q2. I’ve added Lufthansa Group to that chart and it turns out that they actually paid the highest prices of all three groups in the quarter.
Source: Company reports, GridPoint analysis and estimates. Includes SAF premium but not emissions costs.
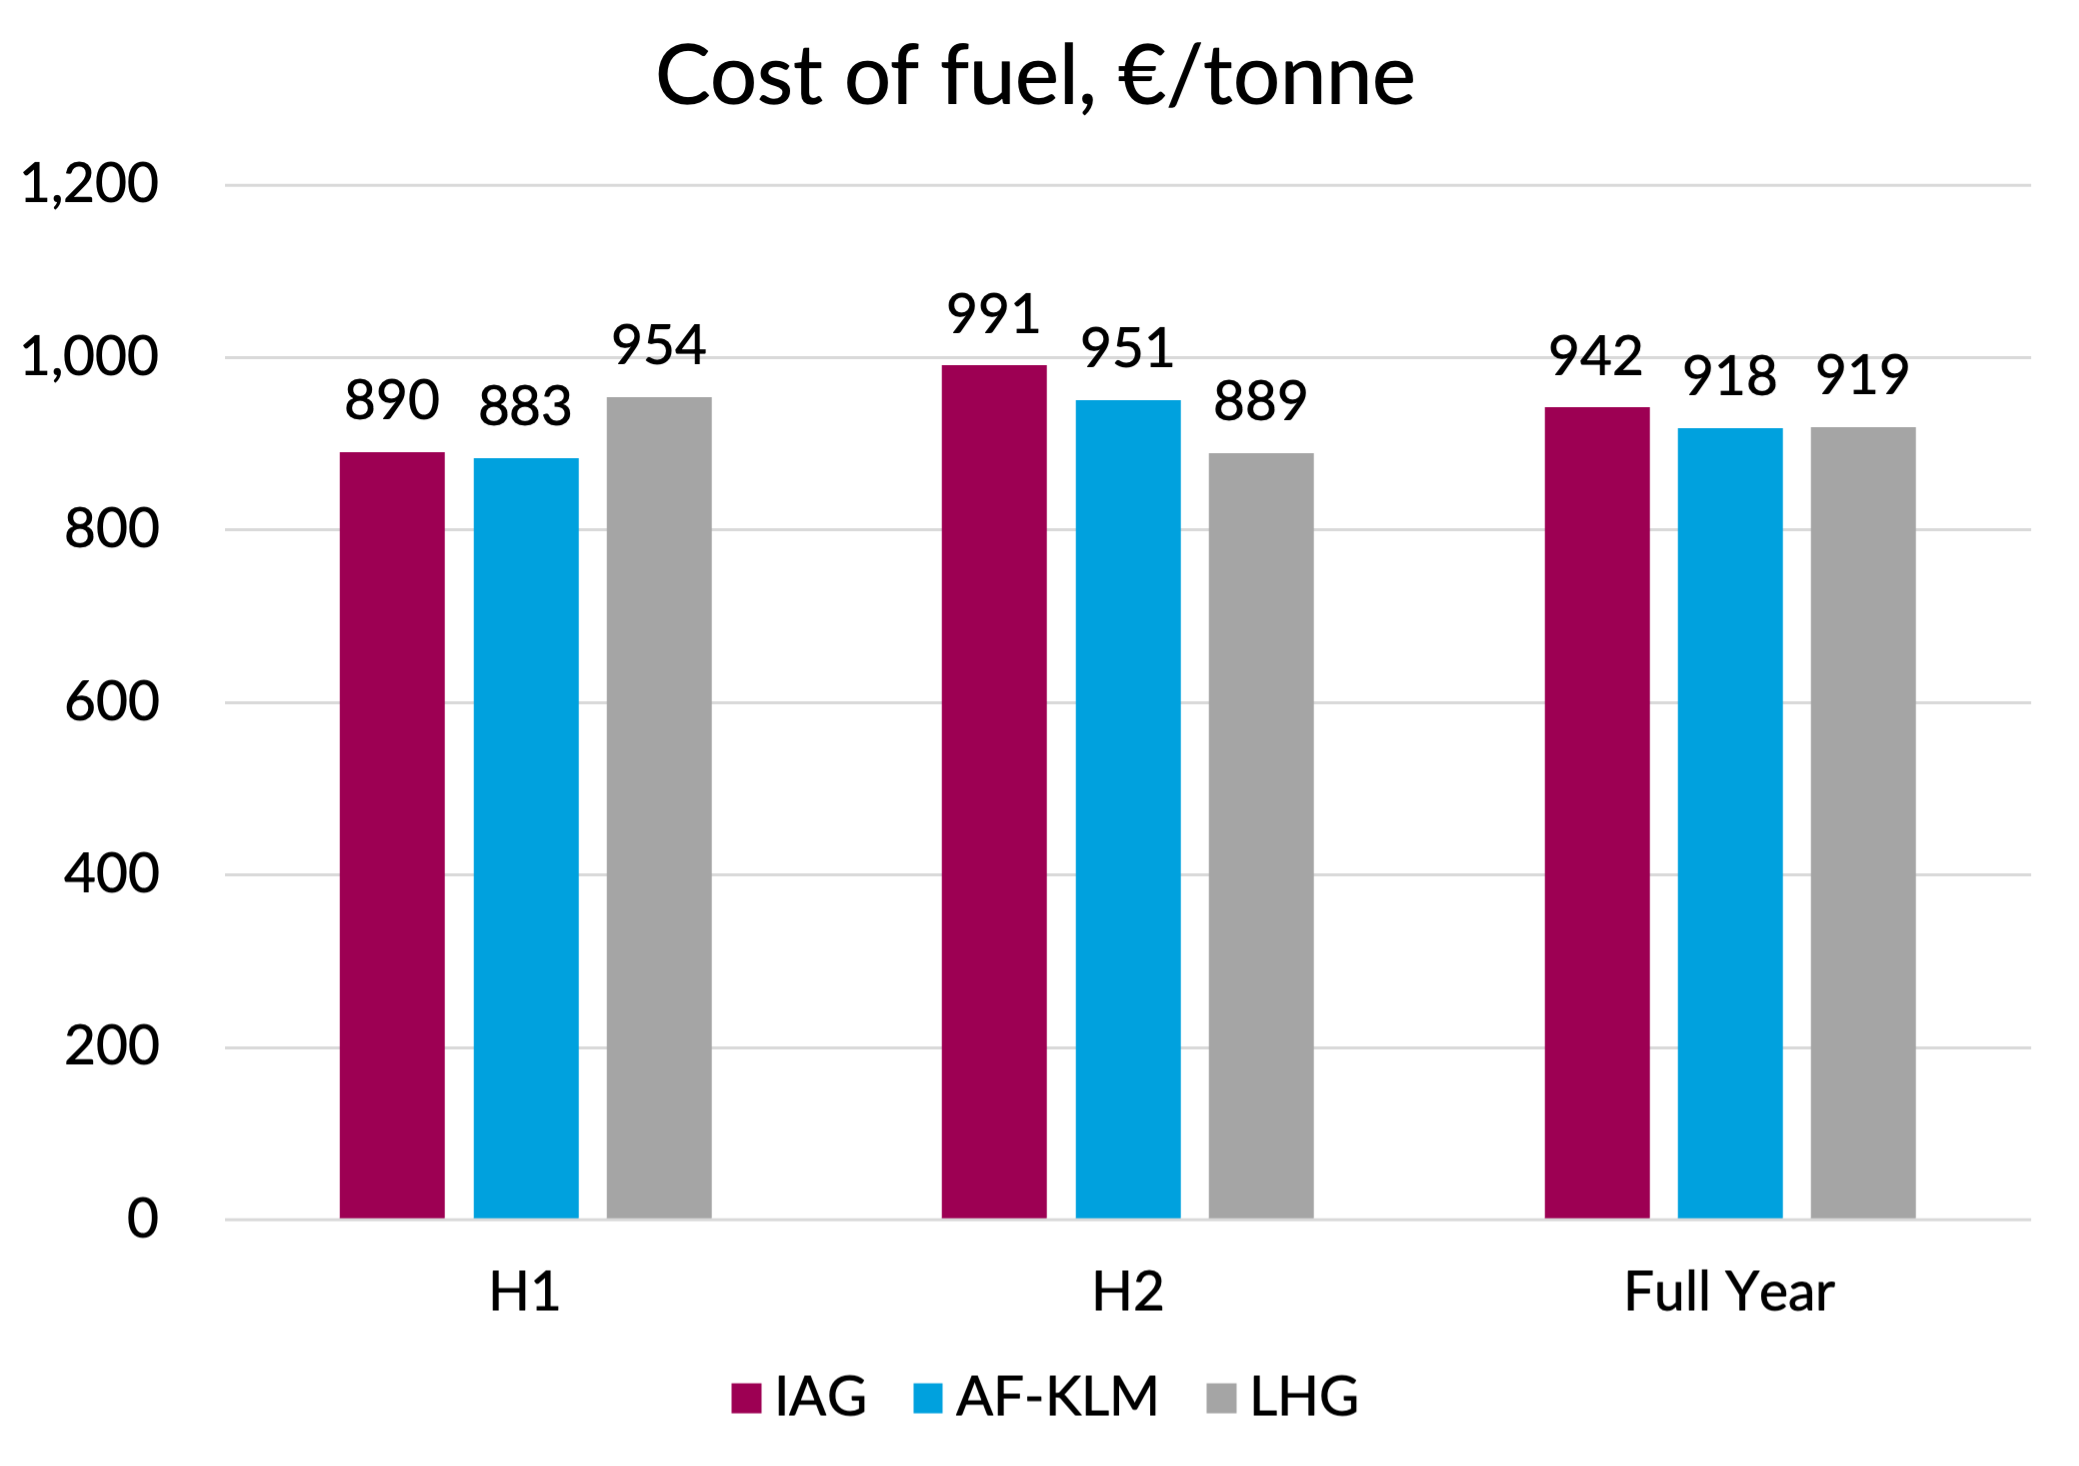
Where Lufthansa’s higher level of hedging does look like it will pay dividends is in later periods. Each group provided full year forecasts for fuel cost. Very helpfully they all provided figures based on the forward curve at the same date - 27th July. Of course, they weren’t all on the same basis. IAG’s figure seems to be an “all in” amount, i.e. including SAF premium and emissions costs. The other two excluded emissions costs. Lufthansa and IAG gave their figures in euros, whereas AF-KLM’s was in dollars. So I had to do a few sums to put them on the same basis. The following chart shows the resulting average cost of fuel per tonne in euros, including SAF premium and into-plane costs, but excluding emissions costs.
Source: Company reports, GridPoint analysis and estimates. Includes SAF premium but not emissions costs.
The story seems to be that IAG had the best short-term hedging for Q2 but on a full year basis will end up with the highest costs. For the full year, AF-KLM and Lufthansa Group look almost identical, although with a different H1/H2 balance.
The differences don’t look that big on the chart, but they are quite material financially. For IAG, the difference between their projected H2 cost per tonne and that of Lufthansa amounts to about €450m in H2.
Non-fuel costs
In my last post, we saw that IAG did much better than AF-KLM on non-fuel unit costs in Q2. How did Lufthansa Group do?
Tackling that question is rather tricky, because as we’ve seen Lufthansa separates out its MRO and Cargo businesses in its reporting. Those businesses are also very substantial, so “bundling them in” as IAG does will have a bigger distorting effect. Third-party MRO activity and dedicated freighter operations don’t generate ASKs, so including their costs inflates the unit cost figures in an unhelpful way.
I decided to try to look at all three groups using the same approach as Lufthansa does. Firstly, we remove currency gains or losses from operating costs. To be clear, this isn’t a “constant currency” analysis. We are not removing the impact that currency has on operating costs, just getting rid of any non-cash FX losses from translating working capital balances. Secondly, to work on the same basis that Lufthansa does, we need to strip out the costs of third-party sales in MRO and ground handling, the non-flight costs of the Holidays businesses, the costs of dedicated freighters and the marginal costs of belly cargo. I had to make assumptions about the margins of third-party revenues, but the scale of those businesses at IAG and AF-KLM is small enough that the results aren’t that sensitive to the specific assumptions I made.
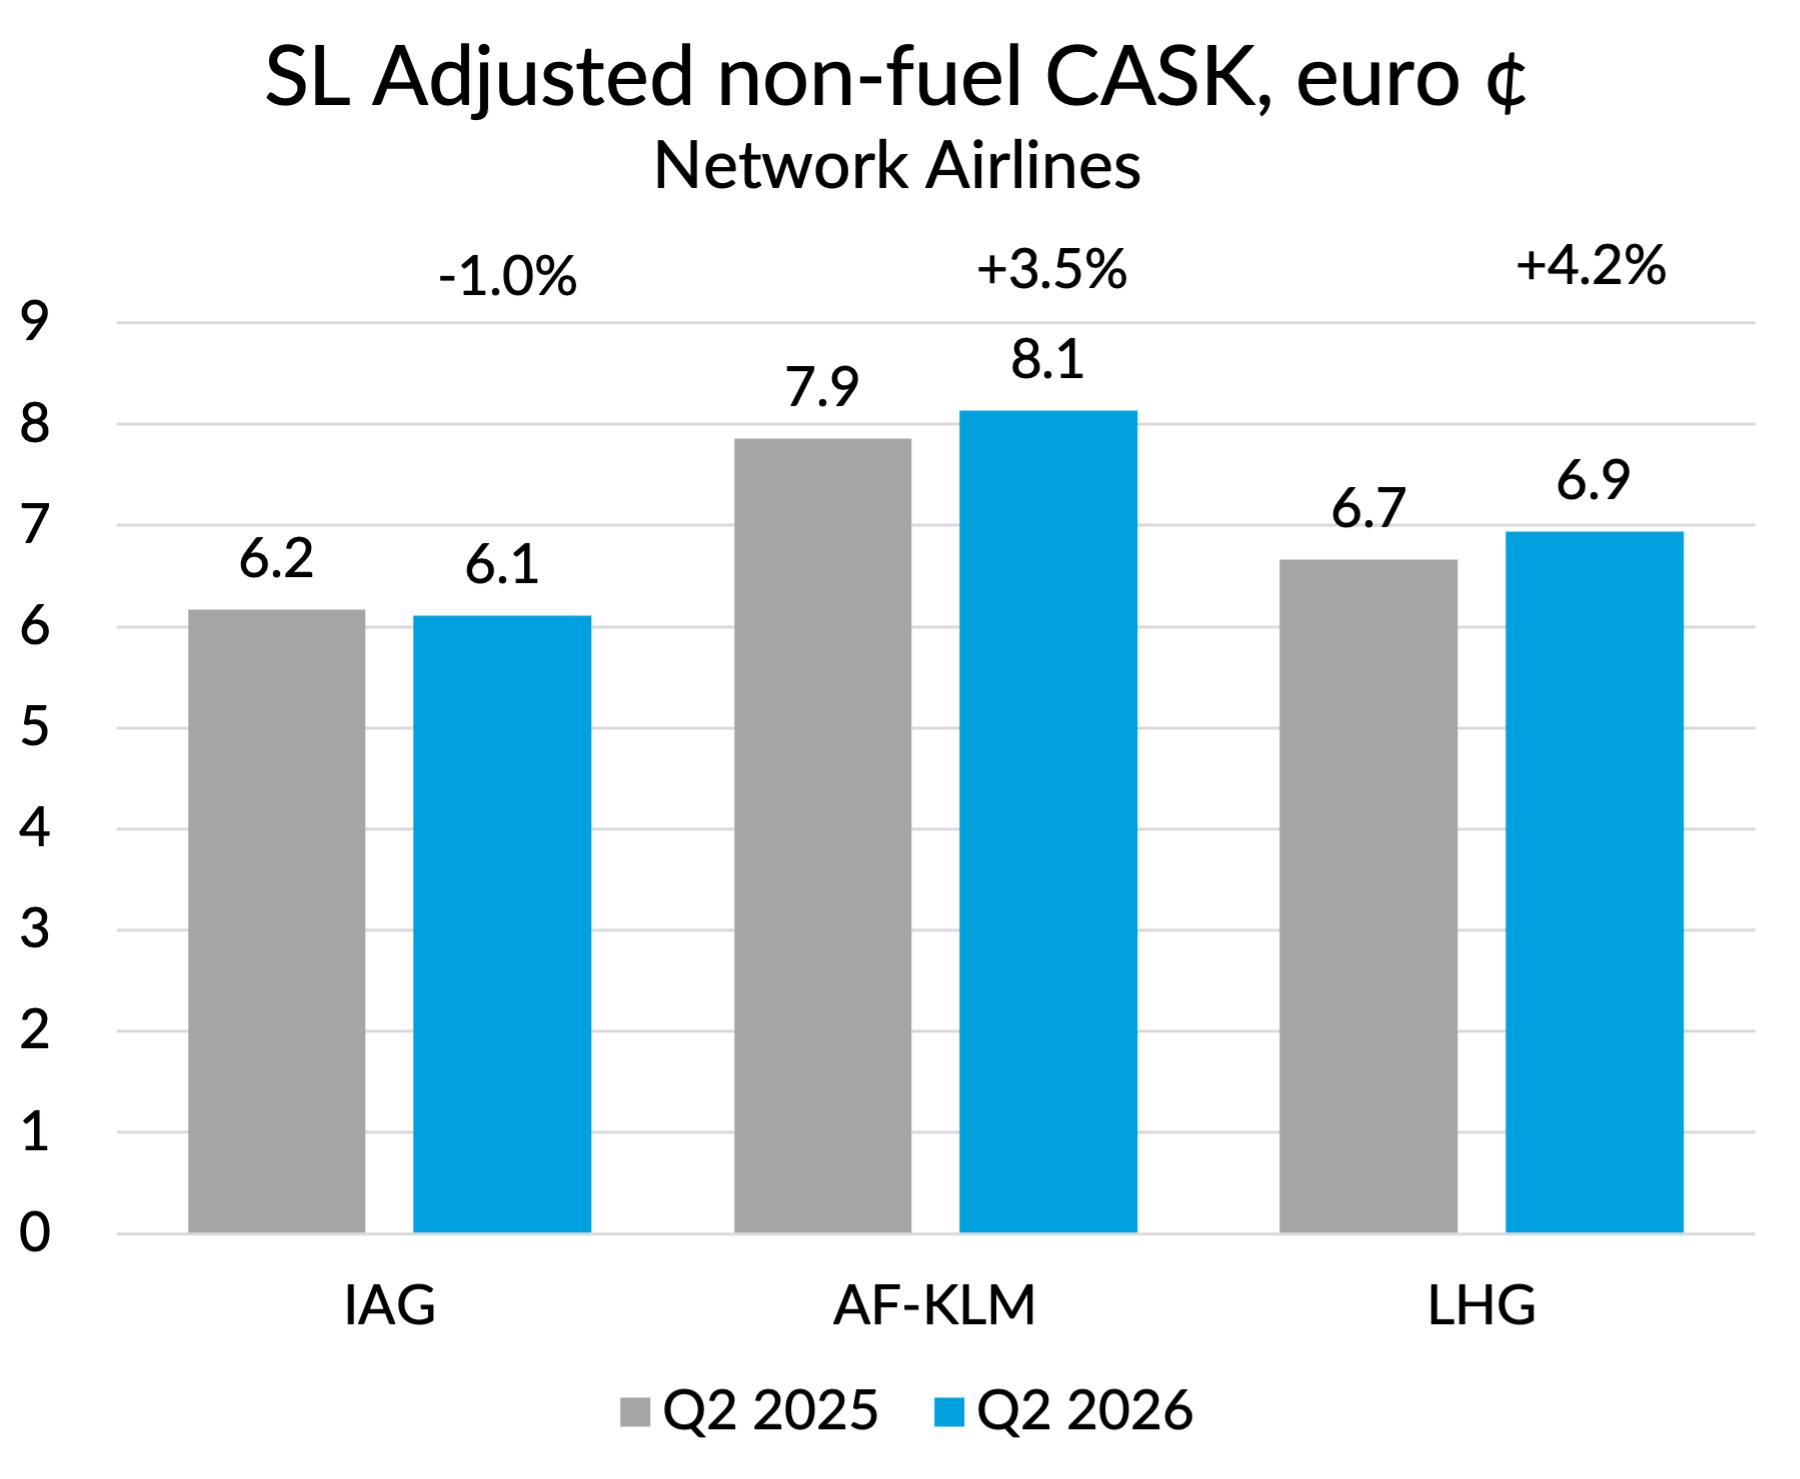
I also decided to adjust the unit cost figures for stage length, because there is quite a bit of difference between the groups and there were also some stage length changes compared to last year. I adjusted the network airline figures to a 2,000 km stage length, which is about what Lufthansa’s network airlines averaged for Q2 2026. That means the metric matches LHG’s reported figure of 6.9¢ per ASK for its network airlines segment.
The results are shown on the chart below. Again, IAG shows a small unit cost improvement versus last year. Lufthansa Group’s unit costs increased by 4.2%, worse than AF-KLM’s 3.5% increase. I guess there was a strike effect in there due to lost production, but it is still not an impressive performance. Remember this was a quarter where airlines, including Lufthansa Group, were cutting back on discretionary expenditures to try to mitigate the fuel price increase.
Source: Company reports, GridPoint analysis and estimates.
You can see that IAG comes out as the lowest cost on this metric, but I wouldn’t put too much emphasis on this analysis as a reliable guide to relative costs. Despite my attempt to normalise for stage length, the impact of network structure and product mix can distort these kinds of high level metrics, so it is best to treat the cross-company comparisons as indicative. But I do think that it demonstrates the size of the cost challenges AF-KLM faces, even though it seems to be offsetting about half of the cost disadvantage through better unit revenues.
As far as Lufthansa Group goes, even adjusting for the strike impact, its network airlines seem to be worse than IAG on both unit revenues and unit costs, with about two thirds of the gap cost-related and a third revenue-related. As a group, it makes up for some of this through strong contributions from its MRO and cargo businesses, but it continues to trail both of its European peers when it comes to the profitability of its core network airline operations.
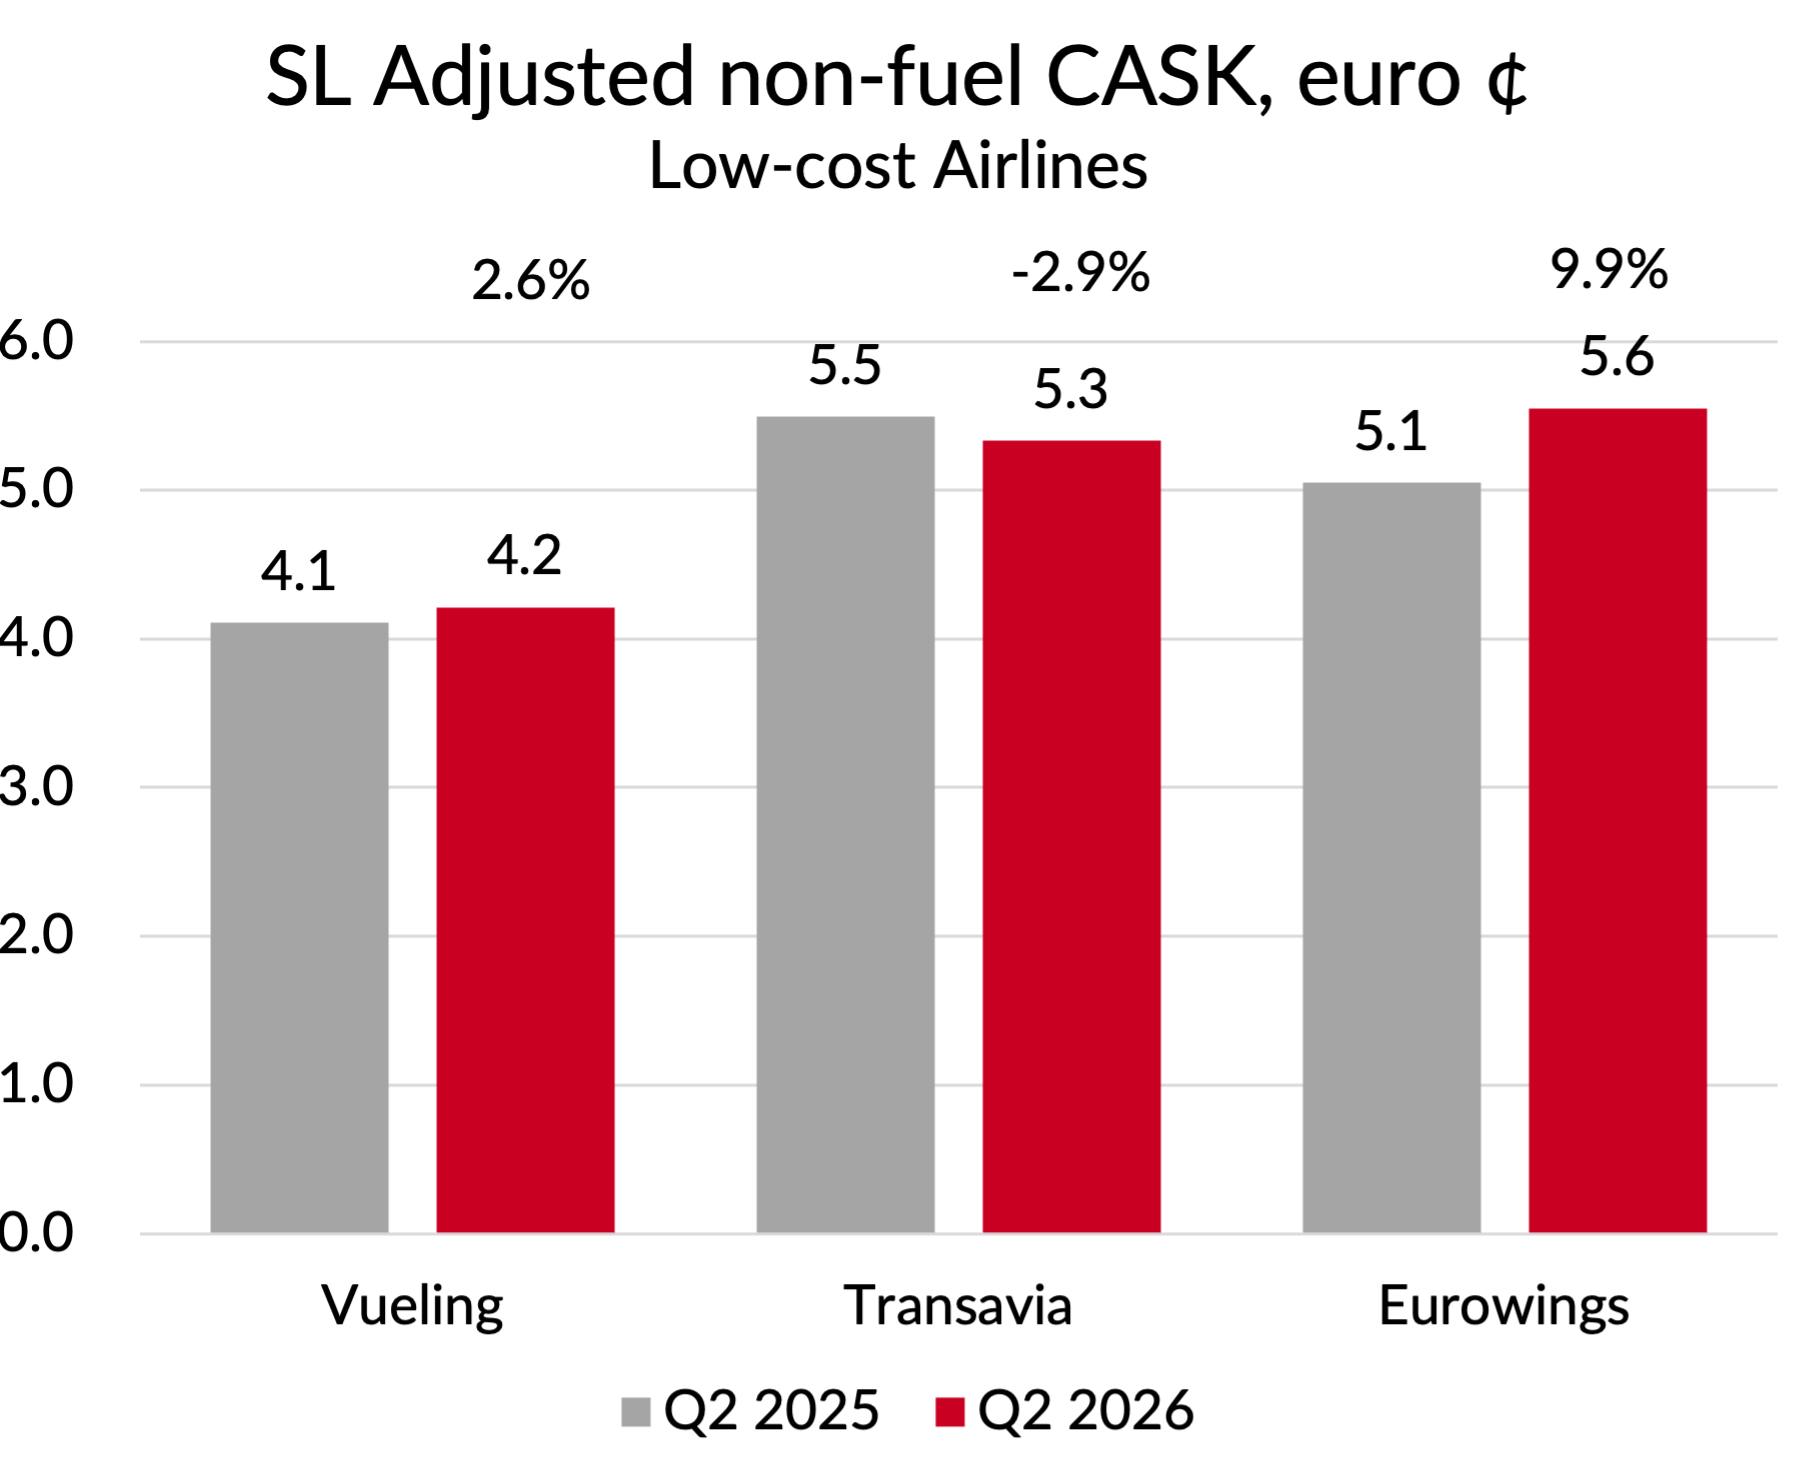
The analysis so far was restricted to the network airlines. Let’s move on to the low-cost units. Again I’ve normalised the figures to a standard stage length. I’ve used 1,300 km here, close to the Eurowings figure for Q2 2026.
Once again, IAG comes out much better than the other two here on absolute unit costs, with Vueling quite a bit lower cost than Transavia or Eurowings. However, versus last year, Vueling is going in the wrong direction with unit costs up by 2.6%, on capacity which shrank by 2.1%. Transavia’s unit costs improved by 2.9%, helped no doubt by a capacity growth of 7.3% as it took over routes from Air France at Orly.
The results for Eurowings were rather startlingly bad, with a 9.9% increase in non-fuel unit costs compared to last year. Yes, that was partly a result of shrinking capacity by 6.5%, but even allowing for that it’s a pretty terrible performance. Management’s written commentary was rather unhelpful, saying the rise in unit costs was “due to the decrease in capacity, higher expenses for aircraft maintenance and increased expenses for fees and charges as well as staff”. On the investor call, the costs of preparing for the transition from an Airbus fleet to a Boeing fleet were cited, which makes a bit more sense.
Source: Company reports, GridPoint analysis and estimates
What about revenue?
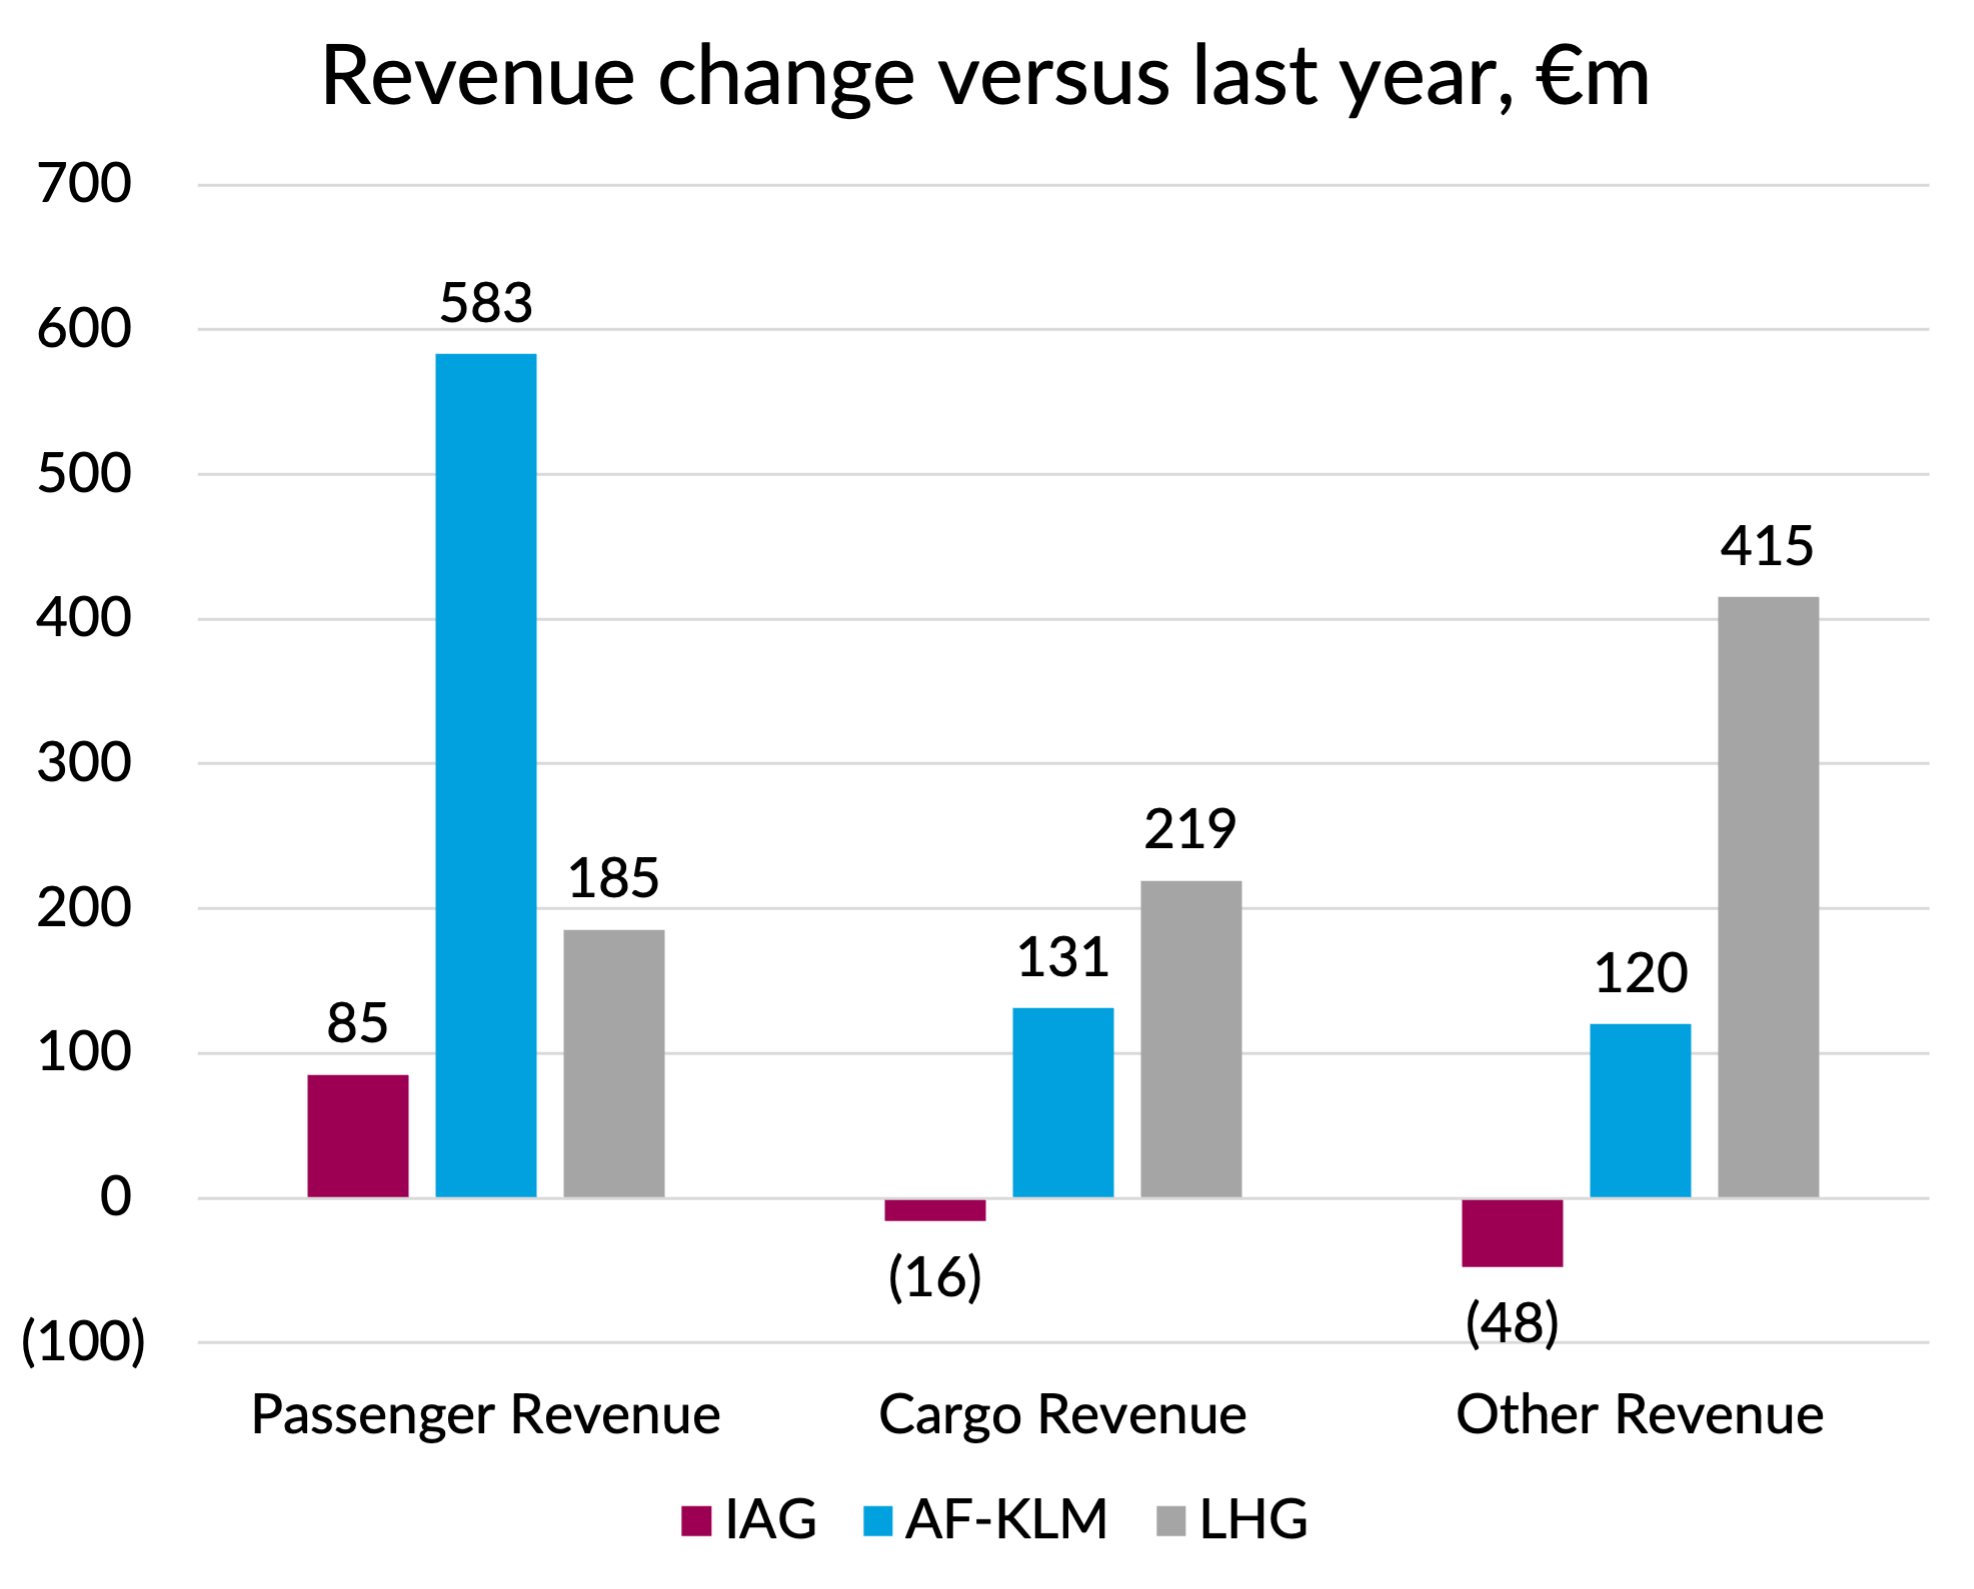
On the revenue side, there were big increases in both cargo and “other revenue”. 78% of the growth in other revenue came from third-party maintenance, which rose by 23%. Lufthansa’s large cargo business also did really well, helped by a 27% increase in yields driven by disruption to Middle Eastern competitor capacity.
Source: Company reports, GridPoint Analysis
On the passenger revenue front, Lufthansa Group’s performance looks to be “in the middle” of AF-KLM and IAG, at least in terms of absolute revenue increases. But there were big differences in capacity growth at each airline, so let’s take a closer look.
Capacity
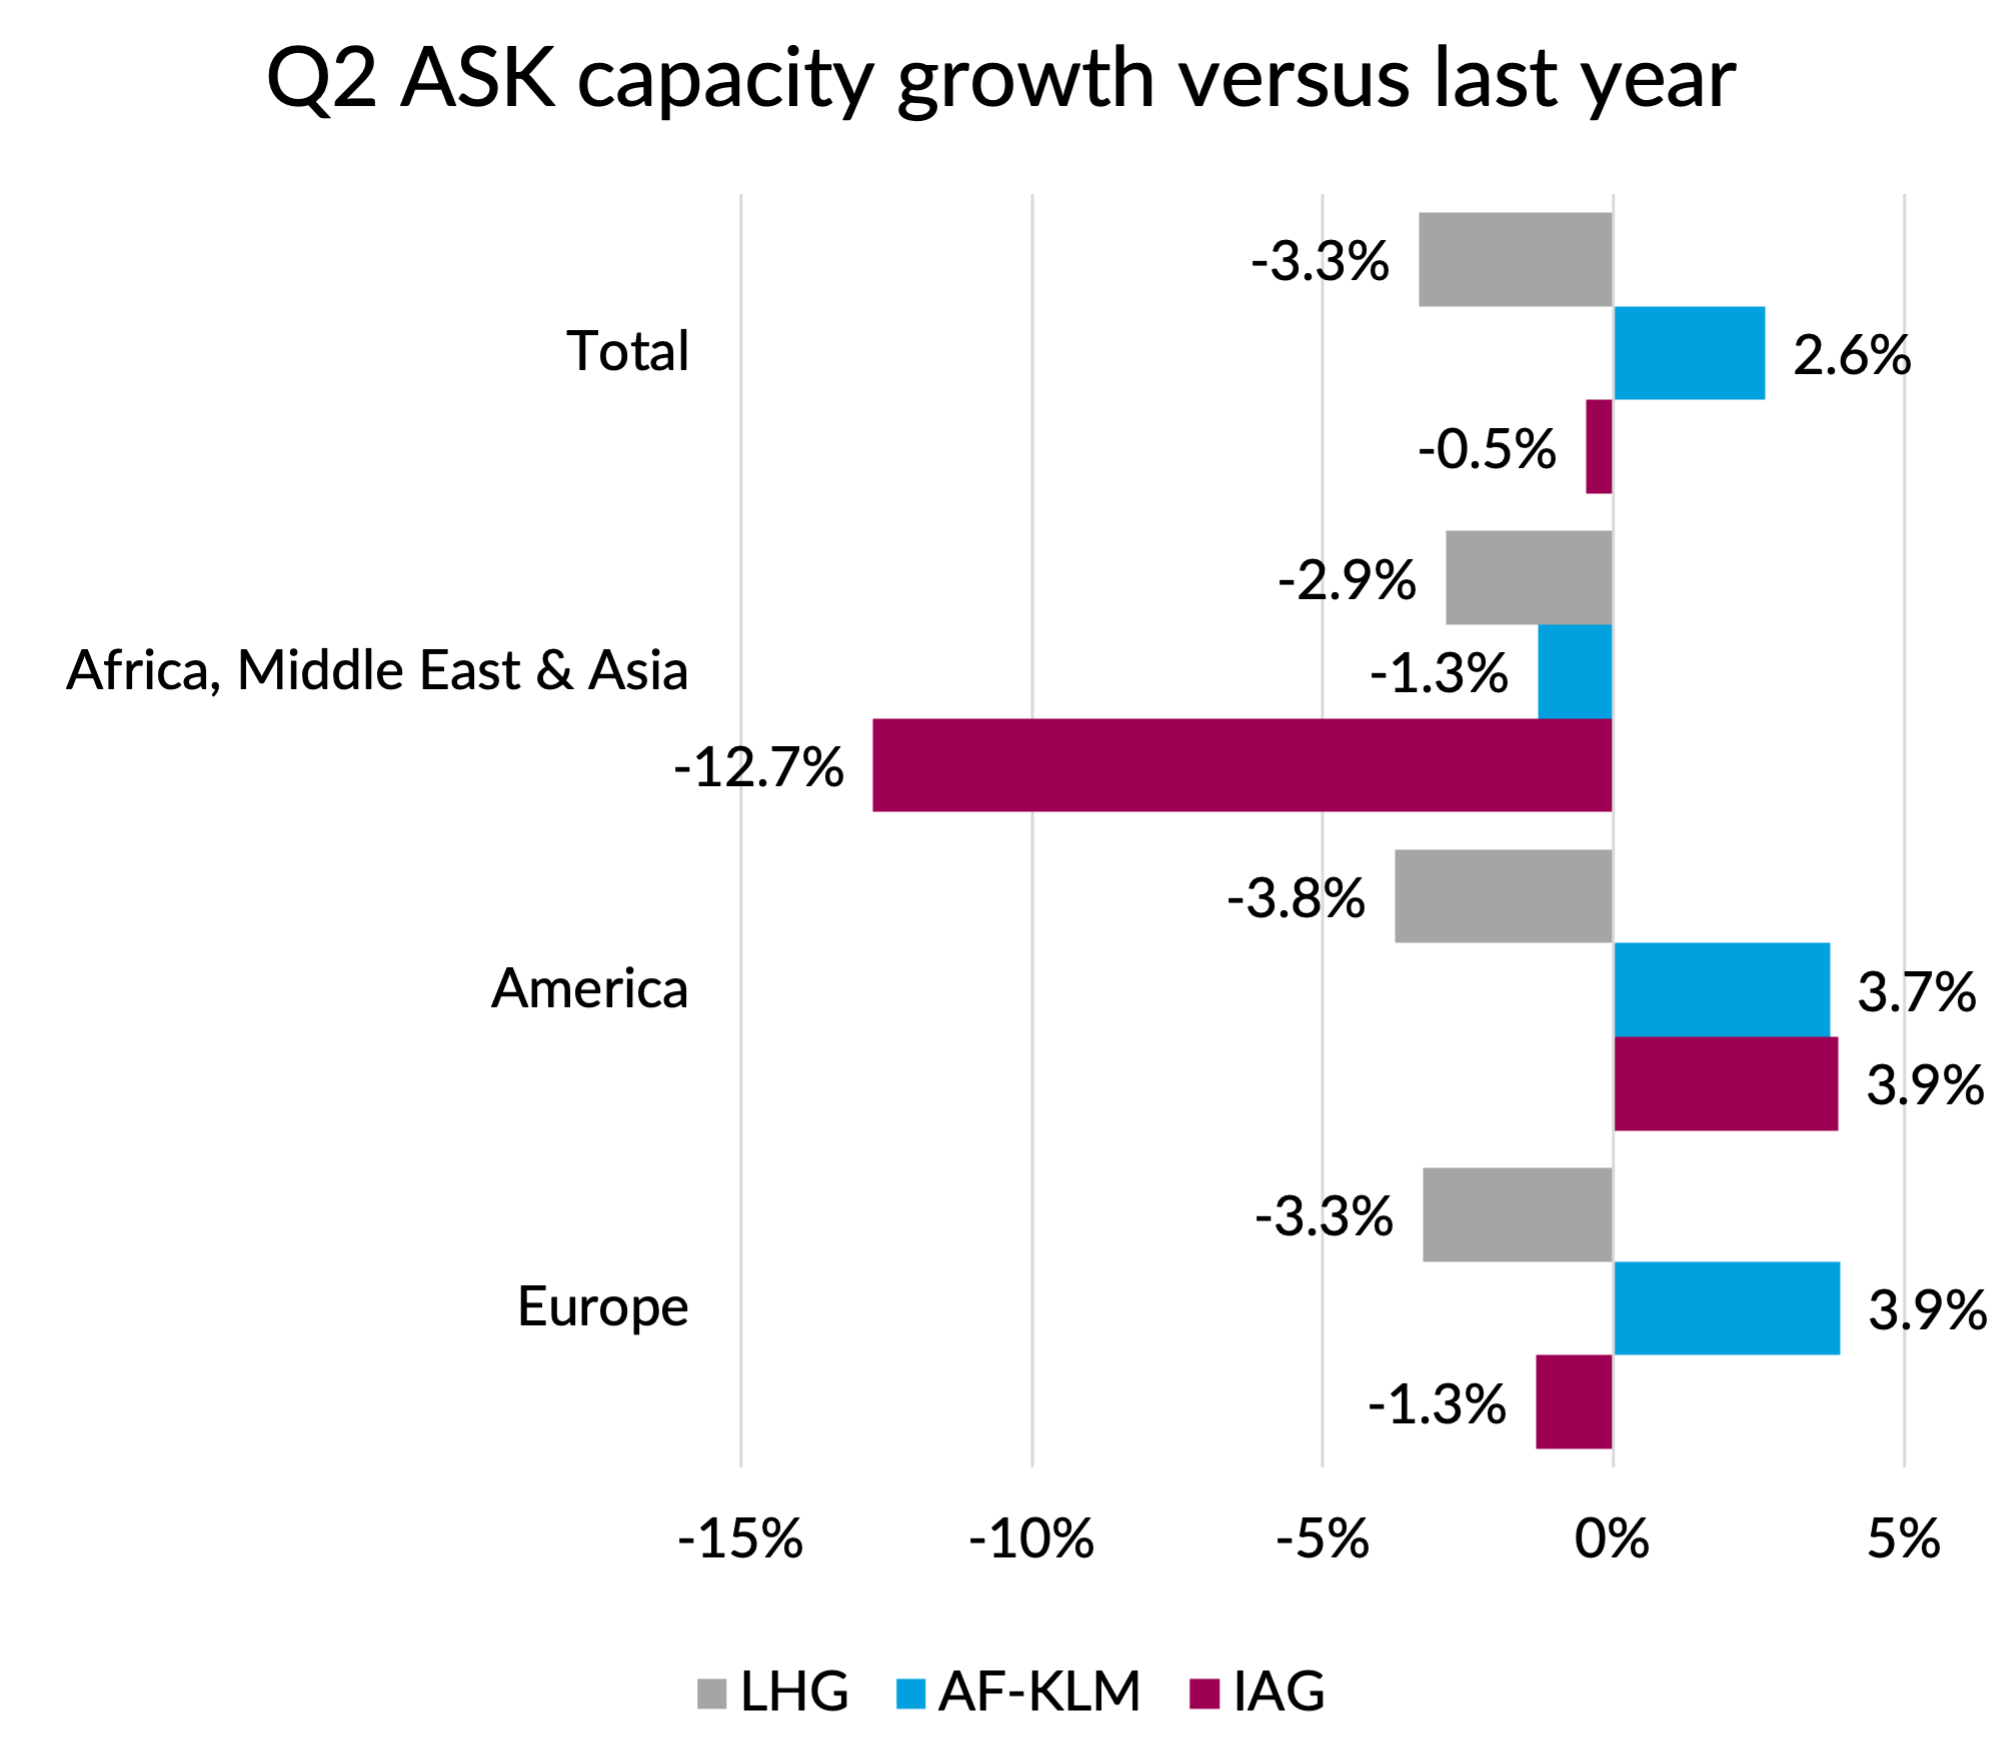
For the regional analysis which follows, I’ve had to group some more regions compared to what I did when analysing IAG and AF-KLM. That’s because Lufthansa doesn’t split its figures between North and South Atlantic. The analytical curse of needing to use the lowest common denominator strikes again.
Overall, Lufthansa Group cut capacity much more significantly than the other two groups. By region, that was particularly evident in Europe and across the Atlantic. The cut in capacity on the North Atlantic was partly down to strike effects - the company prioritised other regions, knowing that strike-affected passengers could be moved to joint-venture partner services on the USA and Canada.
Source: Company reports, GridPoint analysis
Unit revenues
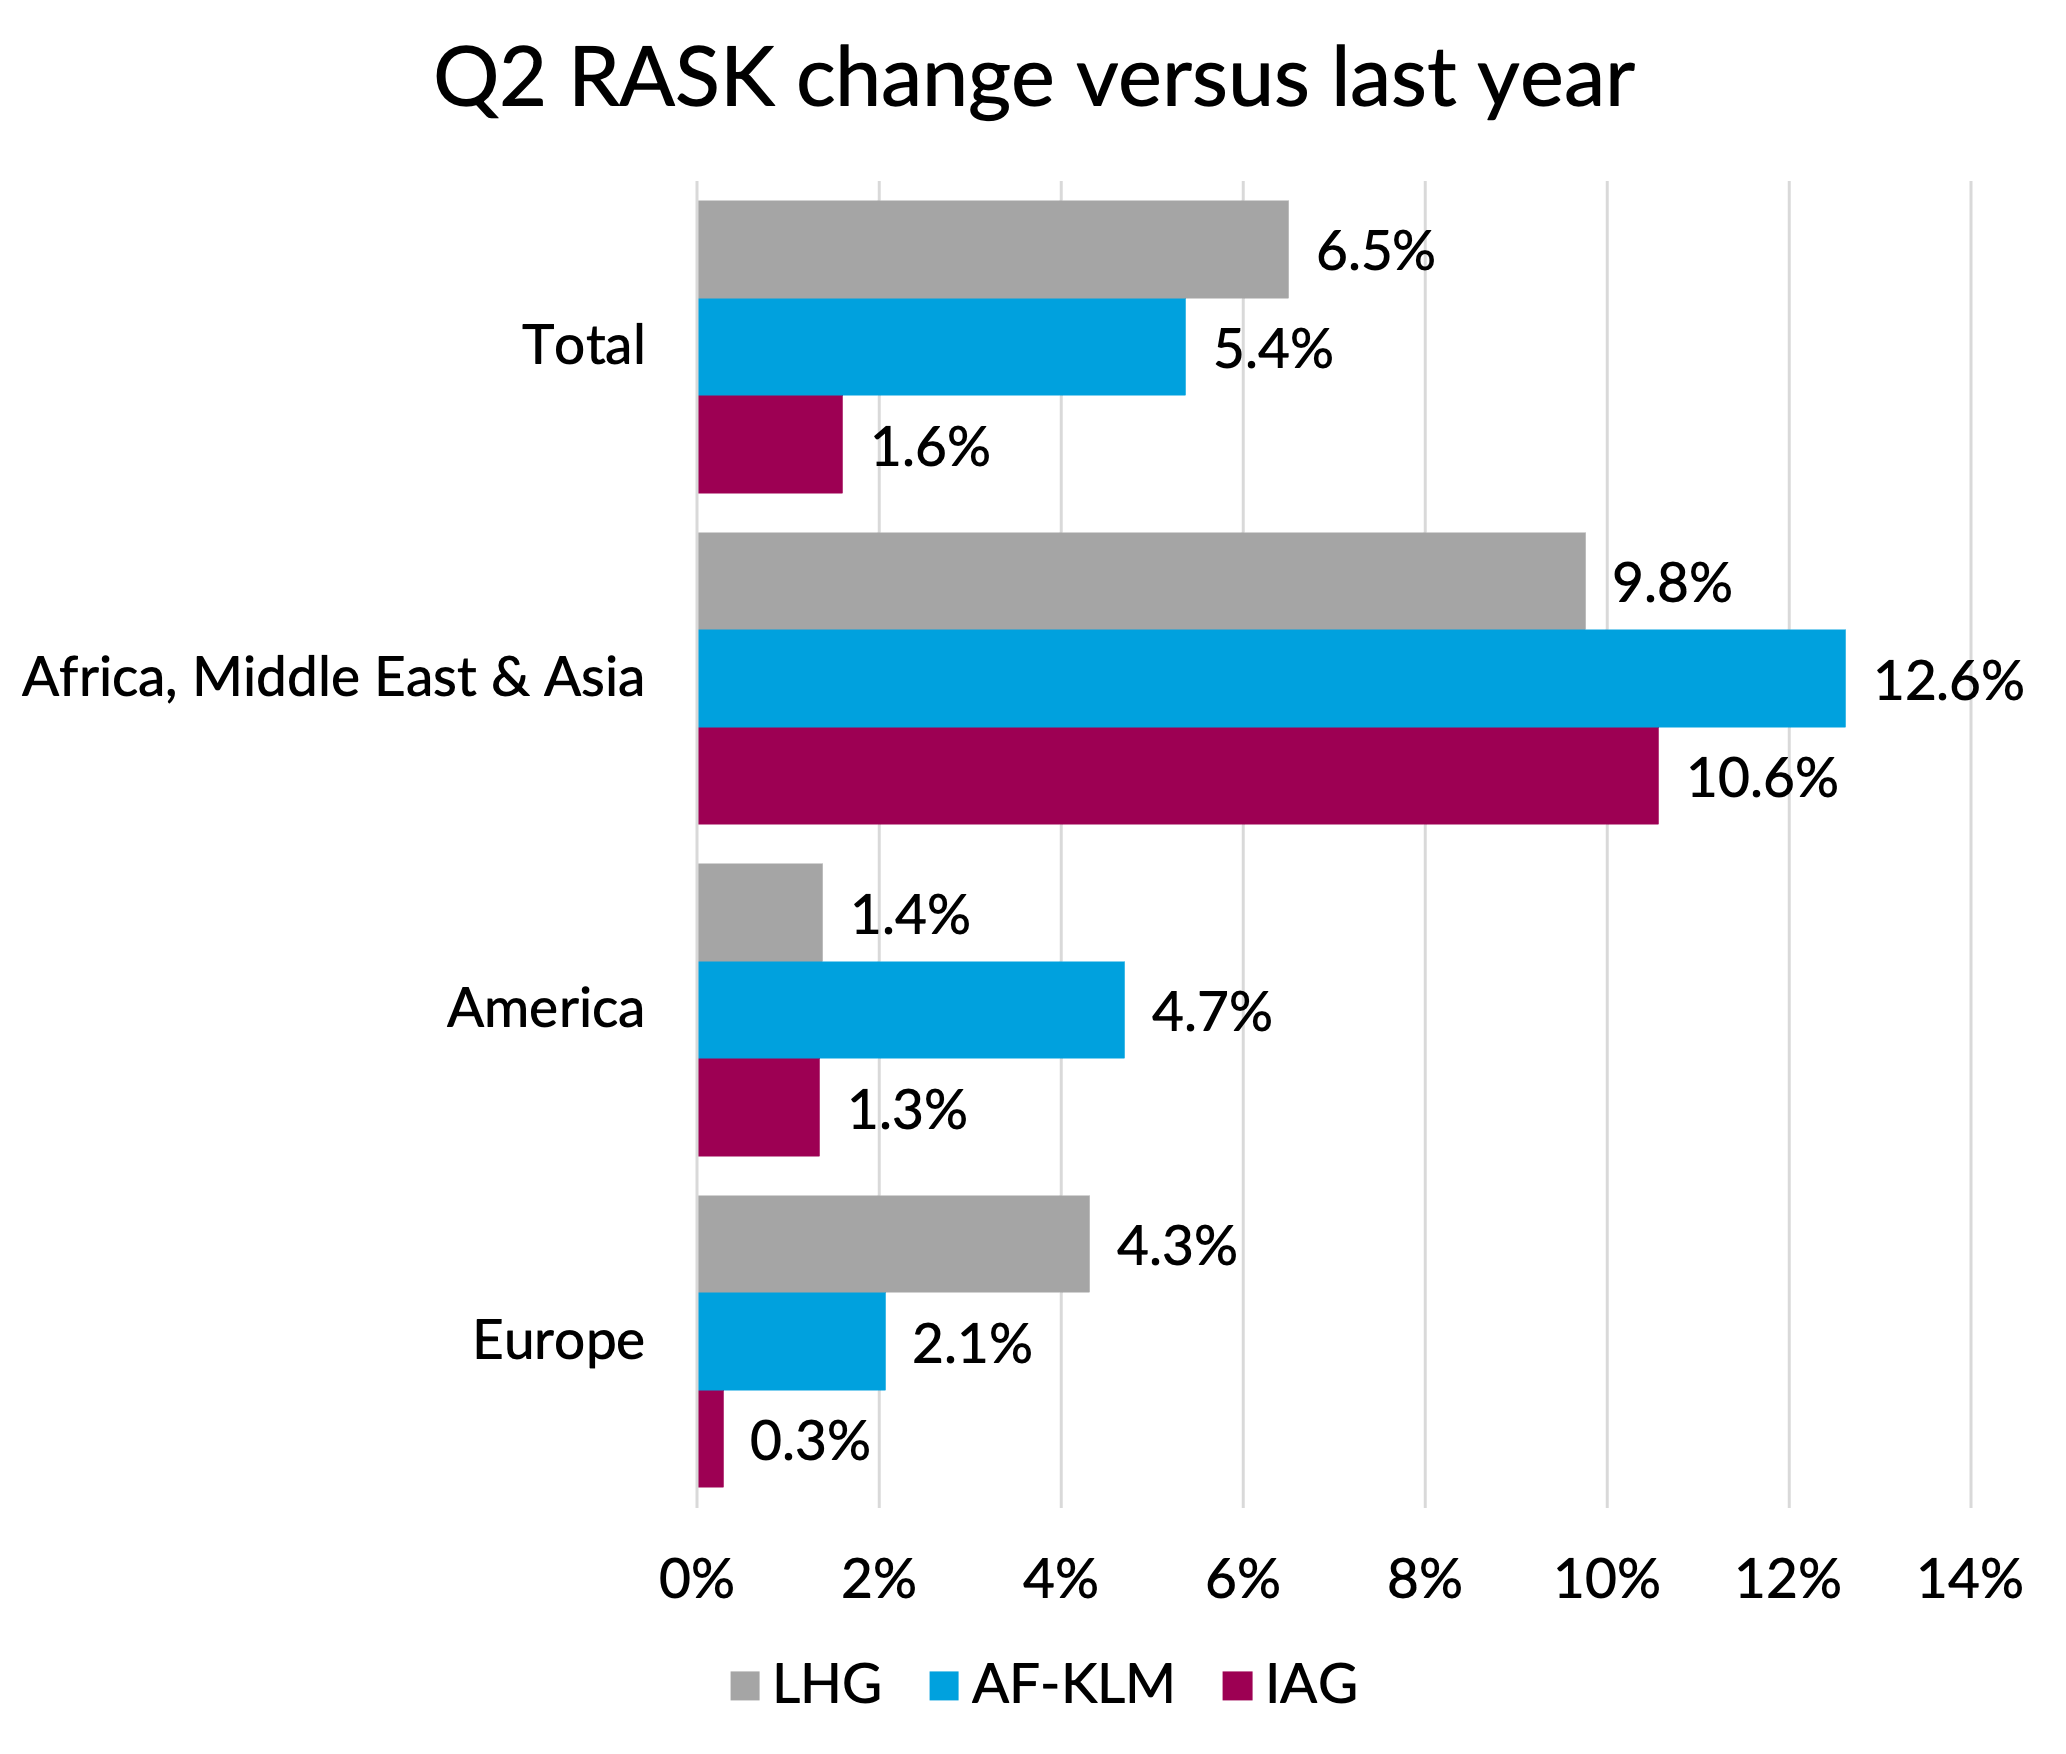
When it comes to overall passenger RASK, Lufthansa Group had the best overall performance compared to last year. I’m sure that was helped by the capacity cuts, although cancellations due to strikes tend to hit yields because you lose the last-minute, high-yielding bookings.
The Atlantic performance looks quite poor at 1.4% given that capacity shrank by 3.8% whilst IAG and AF-KLM both grew their capacity at almost 4%. Again, strike impacts are undoubtedly partly to blame.
The European RASK increase of 4.3% stands out as much better than what we’ve seen from other airlines. That was mainly driven by a 9.3% increase in Eurowings’ short-haul RASK. There were some quite big changes in Eurowings’ network compared to last year, with double digit capacity growth to Portugal and the UK and the suspension of flights to the Gulf. Maybe this route mix change caused a shift towards higher-cost / higher-yield markets and that’s at least partly behind the rise in both CASK and RASK?
Note that the “total” figures here include passenger revenues which weren’t allocated to regions. That increased quite a bit for Lufthansa Group this year for some reason, boosting the overall unit revenue performance compared to what you’d get from just adding up the regional numbers.
Source: Company reports, GridPoint analysis and estimates
Final thoughts
When it comes to the question of whether airlines are succeeding or not in passing on fuel price increases to customers, before Lufthansa’s results it looked like that was happening on North Atlantic and Asian routes, but not really succeeding on intra-European markets.
On the face of it, Lufthansa Group’s figures go against this narrative. They had much stronger European results and quite weak results on the transatlantic. However, their Atlantic results were quite impacted by strike effects, so I don’t think we should put a lot of weight on them. Maybe the European results provide a bit more encouragement to the short-haul pricing story, but unsurprisingly perhaps they were only achieved with substantial rationalisation of capacity. That came, of course, with some adverse unit cost implications.
As the industry heads into the winter with fuel prices remaining inflated, working out how to strike the right balance between the unit revenue and unit cost consequences of capacity cuts will no doubt be exercising the minds of airline executives over the next few weeks.