
Megahubs 2025

The most connected airports in the world?
Every year, OAG publishes a ranking of the “Top 50 “Global Airport Megahubs”, which they claim “delivers the key statistics on the most connected airports in the world”. They’ve just released the 2025 update, which you can find on this link. I’ve reproduced their top 15 here, with Heathrow topping the list, as it did in 2024. If you compare this table to the one in OAG’s report, you’ll see I’ve added a “Connections per destination” column. We will see why in a minute.
| Rank | Code | Airport Name | Connections | Destinations | Conx / dest |
|---|---|---|---|---|---|
| 1 | LHR | London Heathrow | 59,240 | 226 | 262 |
| 2 | IST | Istanbul | 82,733 | 327 | 253 |
| 3 | AMS | Amsterdam | 66,798 | 275 | 243 |
| 4= | KUL | Kuala Lumpur | 36,159 | 151 | 239 |
| 4= | FRA | Frankfurt | 73,221 | 307 | 239 |
| 6 | ICN | Seoul Incheon | 41,572 | 179 | 232 |
| 7 | ORD | Chicago O'Hare | 65,141 | 297 | 219 |
| 8 | ATL | Atlanta | 53,374 | 251 | 213 |
| 9 | HND | Tokyo Haneda | 22,243 | 107 | 208 |
| 10 | CDG | Paris Charles de Gaulle | 57,014 | 299 | 191 |
| 11 | SIN | Singapore Changi | 28,021 | 161 | 174 |
| 12 | BKK | Bangkok | 29,447 | 172 | 171 |
| 13 | DFW | Dallas / Fort Worth | 45,627 | 272 | 168 |
| 14 | JFK | New York J F Kennedy | 34,485 | 208 | 166 |
| 15 | DXB | Dubai | 46,104 | 280 | 165 |
I thought the ranking seemed a little odd. For example, I was surprised to see Heathrow topping the list, and I also thought the massive US hubs and Dubai would be further up the rankings. Kuala Lumpur at fourth equal also looked odd to me.
So I took a look into OAG’s methodology and the criteria they were using to do their rankings and I thought I’d share what I discovered.
Global = International, apparently
The first thing to say is that OAG have interpreted “top global megahubs” as being about having the most international connections. I thought it would mean “biggest hubs in the world”, or those offering the most connecting opportunities, but apparently not. For some reason an intra-European connecting flight (e.g. Nice to Copenhagen via Frankfurt) counts towards an airport’s status as a global megahub whereas a domestic US connecting flight does not.
Connections per destination? 🤔
Even more oddly, rather than ranking on the number of international connections, they’ve ranked on the number of international connections per destination. WTF?
Heathrow tops the rankings despite having neither the most connections, nor the largest number of destinations. It does so because it is quite good for the number of international connections (number 5), whilst being quite low in terms of the number of destinations (number 14).
The destination count includes domestic points, presumably because a domestic flight can create an international connection in combination with an international one. But I’ve no idea why dividing connections by the destination count tells you anything useful about an airport’s significance as an international hub.
I suppose it tells you something about how good a job an airport is doing creating international connections, given the destination count. A kind of efficiency metric. But doing a good job of overcoming the weakness of a low destination count doesn’t seem to me to be a reason to boost an airport’s position in a ranking table which purports to show the most connected airports in the world.
A case in point is Heathrow and why it comes out on top of the rankings. Although it has fewer destinations that many of the other top airports, the ones it does have are unusually large, measured by flight frequency. That’s a symptom of decades of runway constraints and the crowding out of small markets, not an indicator of being a particularly good “global megahub”.
Fixing the rankings
OK, so let’s fix the rankings using a better methodology.
OAG have calculated the number of connections by looking at a single “peak day”, Friday the 1st August, 2025. A connection is included if it involves at least one international leg, is feasible from the perspective of minimum connecting time (MCT), involves a wait of less than six hours, and has a circuity of 1.5 or lower. This last point means that the connecting journey should involve travelling less than 50% further than would be involved for a direct flight.
OAG’s destination count is computed over the entire year ending August 31st, which is actually quite a bit different from the number of destinations served on their peak day. But dividing by the destination count is already a whacky idea, so why not add in some more inconsistency?
In coming up with my own set of ranking figures, I took a slightly simpler approach to calculating the number of connections. I didn’t bother checking the specific timings of all the flights to ensure a connection was in the MCT to six hour time window. As well as being complex to compute, I’m not even convinced it is the right approach. Let me illustrate with an example where there are three morning arrivals from airport 1 and three afternoon departures to airport 2. OAG would count that as nine connections, since all the arrivals connect to all the departures. The truth is there are only three different times someone can leave airport 1 and three different times they can arrive at airport 2. That seems like we should count that as three connections, not nine, as the other six permutations will be strictly inferior from a customer point of view.
What I did instead was to assume that when considering connections between an airport served three times a day and one served once per day, there would be a once per day connecting opportunity (i.e. I took the lower of the two frequencies). That might end up including some connections which are not feasible (misconnect or below MCT), and some that are very long, but I think its a better guide than the OAG approach and is much easier to calculate. The frequencies I used were averages for the entire year ending August 31st, rather than working with single day data. I used the same 1.5x circuity cutoff.
Given my earlier comments, I didn’t of course divide by the destination count. I also included all connections, not just international ones, although I did split them out to show you the impact of including them. I’ve labelled the chart as “potential daily connections” to reflect the fact that a small subset of these connections will not be feasible.
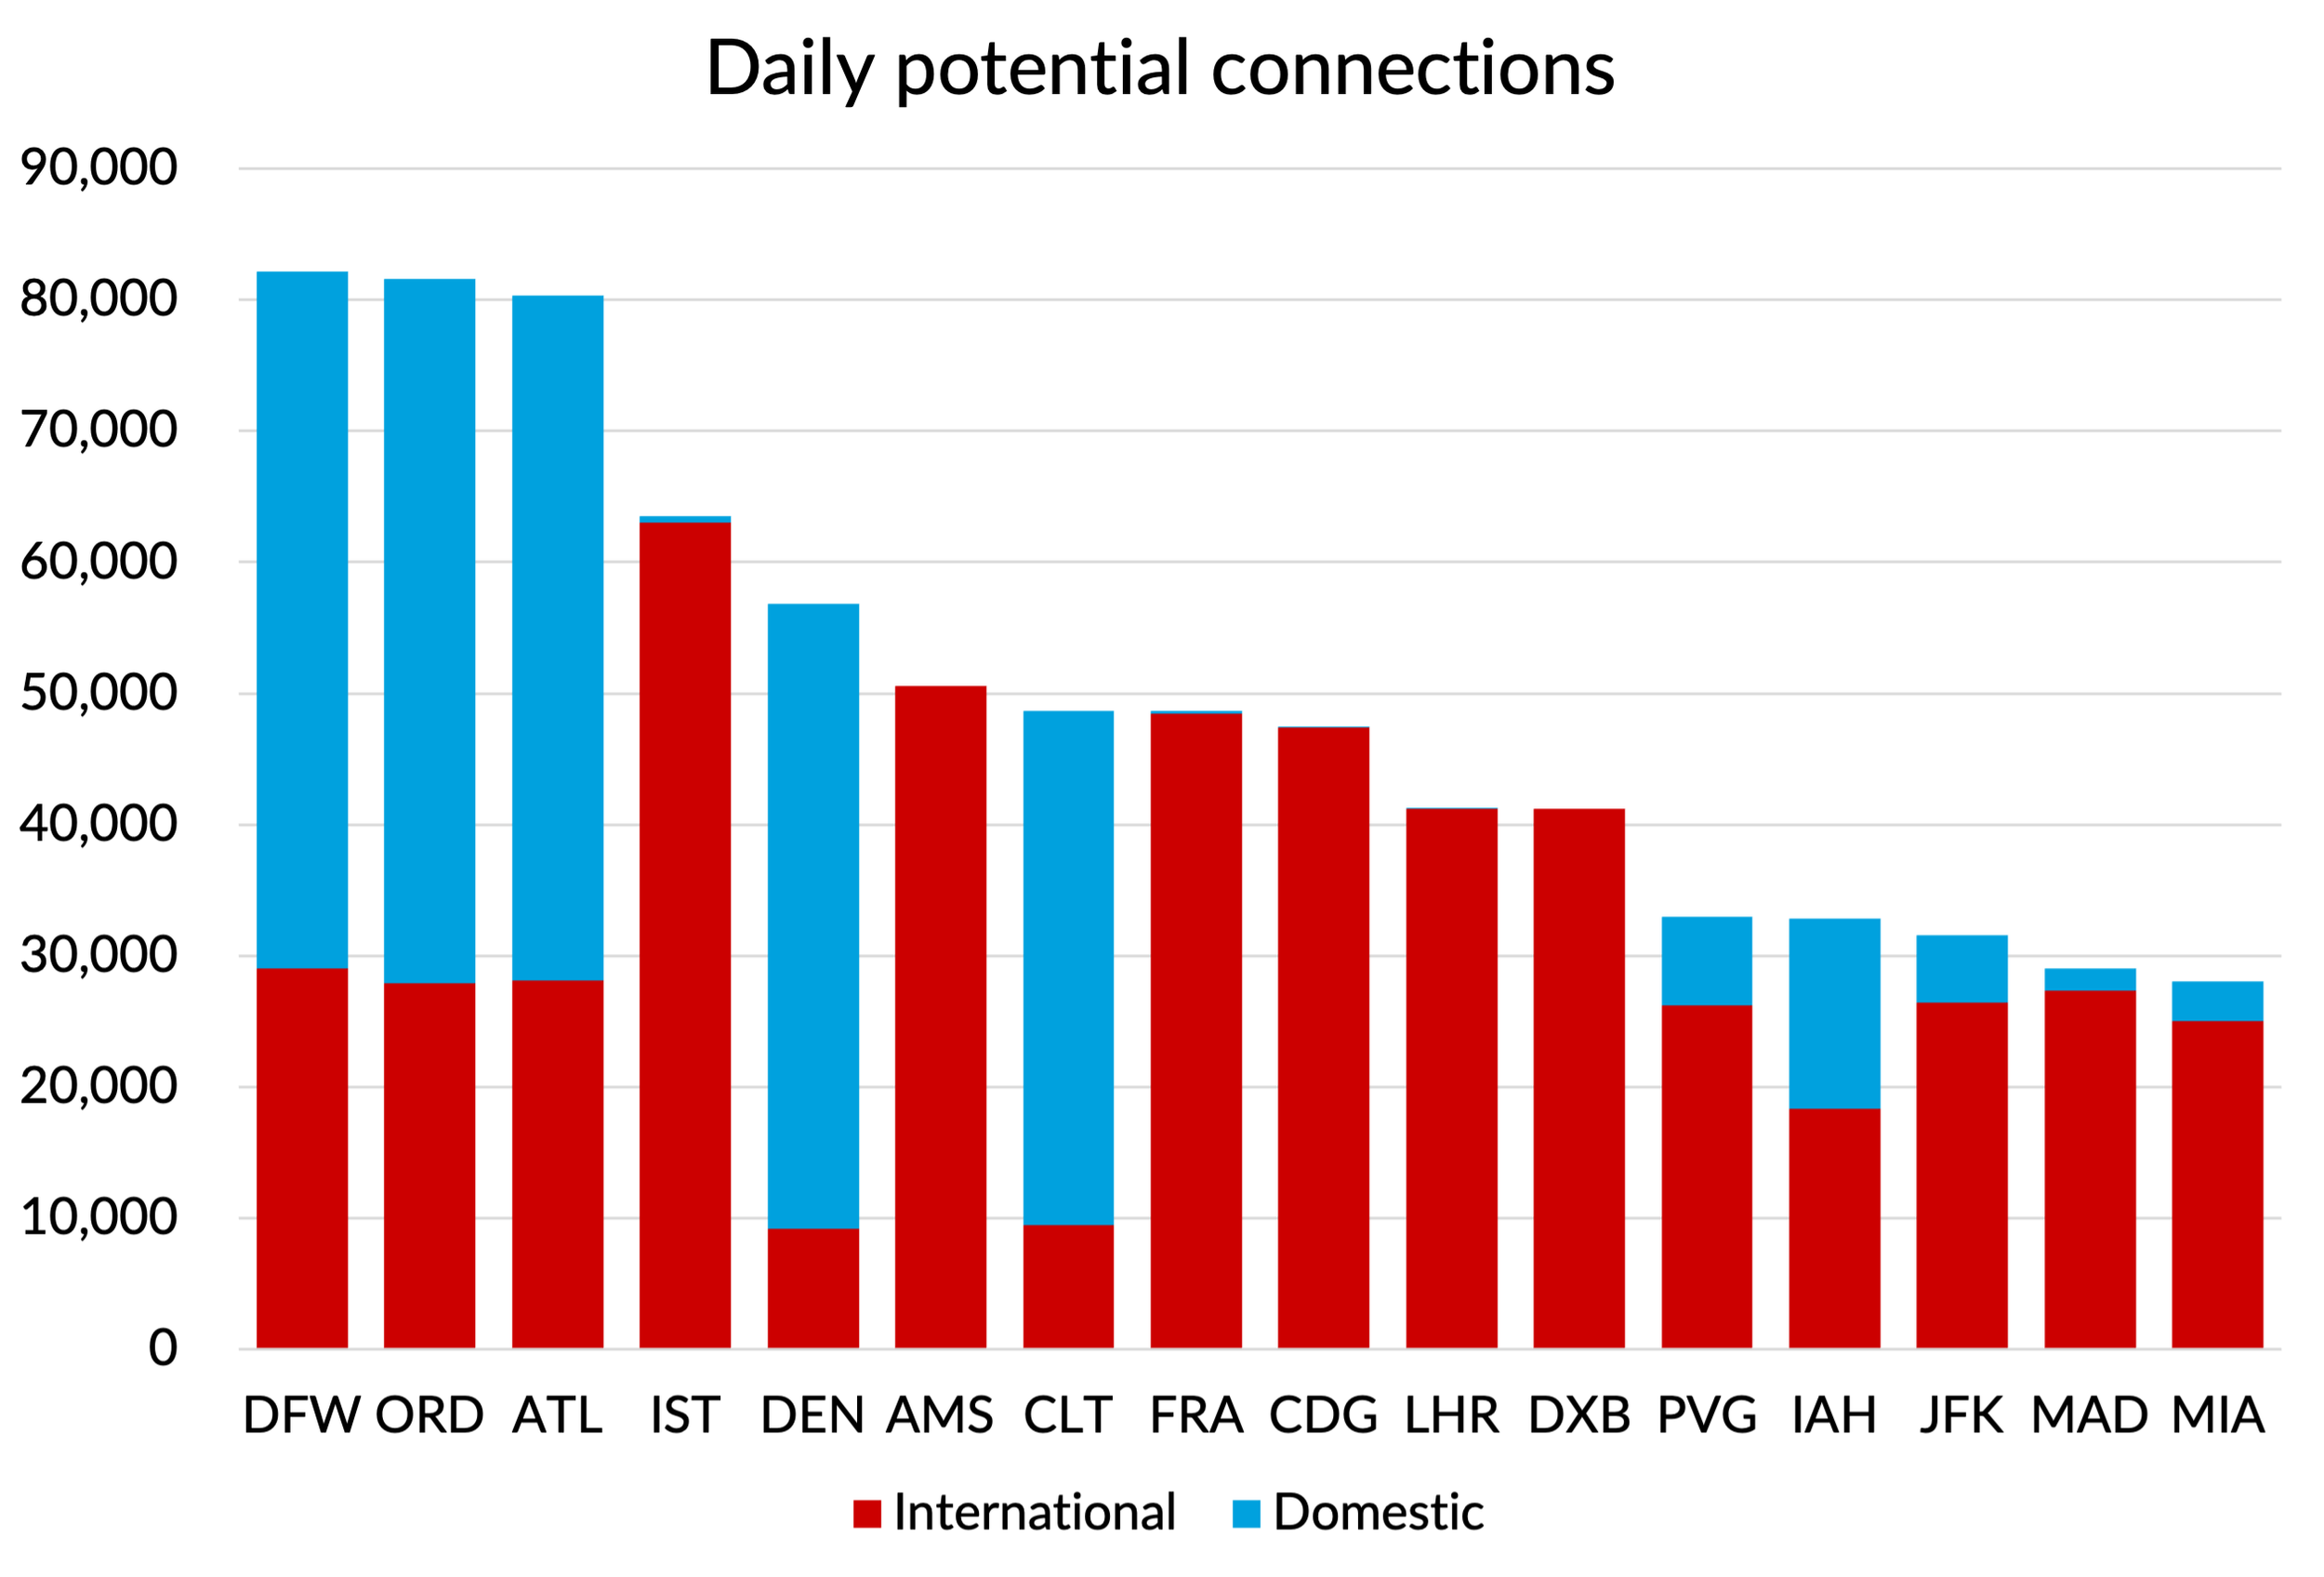
Source: Published schedule data for year ending 31st August 2025, GridPoint analysis
Looking at total connections, including both international and domestic connections, transforms the rankings. On this basis, the world’s top three megahubs are all in the USA, the country that invented the whole concept of an airline hub.
Looking only at international connections, Istanbul tops the list and Heathrow comes in at number five. OAG would have had the same rankings, if they hadn’t done their “divide by the destination count” nonsense. The relative positions of Amsterdam, Frankfurt and CDG move around a bit, but they are all very close on my metrics.
There are a few bigger differences, with Dubai moving up the rankings and Kuala Lumpur (KUL) disappearing from the top 15 entirely. On my analysis, KUL comes out ranking way lower on the number of international connections (#30) than it does in OAG’s numbers (#13). I think it is probably connected to the fact that from KUL there are 38 flights a day to Singapore and 28 flights a day to Jakarta. We saw from my earlier example that I think the OAG methodology overweights the connecting significance of high frequency routes.
What about long-haul connections?
Where I do have some sympathy with OAG restricting its connections count to international journeys is an attempt to reflect the relatively higher economic importance of long-haul journeys. But “international” does not equate to “long-haul”. I’ve redone my analysis looking only at long-haul connections, defined as having a great circle distance between the origin and destination points of 3,500 kilometres or more. That’s about the distance from London to Tel Aviv and the sector length where most airlines switch from using narrow-bodies to wide-bodies.
Here’s the revised chart. You can see that introducing a distance cut off of 3,500 km does eliminate most domestic connections. But it also excludes a lot of other intra-regional connections, which got included in OAG’s numbers when the only filter applied was “international”.

Source: Published schedule data for year ending August 31st 2025, GridPoint analysis
On this basis, Istanbul again comes out as number one for connectivity, with Dubai moving up to number two in the rankings. Heathrow makes it into number three position, with the other big European hubs of CDG, FRA and AMS not far behind. The big US international hubs of ORD, JFK, ATL, LAX and DFW fill the next five slots. Once again, this picture is much more in line with what I was expecting to see.
What drives connectivity?
Connectivity is in many ways just a numbers game. If an airport has a lot of flights, all other things being equal, that will drive connecting opportunities. That’s one of the reasons why runway capacity is so important for a hub.
Here’s a plot of the top 100 airports for connectivity (no distance cutoff), showing how that compares to the total flights at the airport. I’ve fitted a quadratic regression line to the data, because connectivity should be roughly related to the square of the total number of flights. Double the flight numbers, quadruple the connecting potential.

Source: Published schedule data for year ending August 31st 2025, GridPoint analysis
From the chart, you can see the increasing returns to scale. The line of best fit suggests that doubling the overall flight volume from 550 departures per day to 1,100 increases connectivity by 3.8x. That’s not quite the 4x factor we might expect, but pretty close.
However, you can also see that some airports are quite significantly above or below the line of best fit. If you remember how I calculated the “potential connections”, I didn’t look in detail at the flight timings. So this effect is not being driven by the subtleties of hub design like wave structures, or by how competitive the MCTs are. Those effects are undoubtedly important, but my fairly crude analysis isn’t capturing that. The differences here are due entirely to the route structure and the geographical position of the hub.
Look at CAN, which is located in Guangzhou in China. Despite having a lot of flights, the connecting potential is unusually low. That’s because the airport’s network is very focused on domestic Chinese routes and it is not well positioned geographically for serving domestic connecting journeys, being on the edge of China.

At the other end of the spectrum, Istanbul, Paris CDG, Amsterdam and Frankfurt are well above the line of best fit, with route structures and geographic locations which are highly optimised to drive high connectivity relative to the overall volume of flights at the airport. That’s partly driven by geography, but the fact that a single hub carrier dominates the airport also plays a significant part. At those airports, connectivity is a bigger factor driving the network of the airport than it is at more competitive airports where there is more pressure to focus on winning and defending share on the largest local markets.
Heathrow is above the line, reflecting its role as the UK’s hub airport. But only just above. Heathrow is a more competitive airport that its European rivals, so BA has to put more effort into defending its local market position on key routes, using up scarce slots that would otherwise be available to add network diversity and hub connectivity.
Comparing the big London airports
I thought it would be interesting to compare how the big three London airports score on the connectivity metrics. Heathrow wins on total number of flights due to its two runways, with a yearly average of 660 departures per day. Gatwick and Stansted both only have a single runway and their leisure focus means that even that capacity is only fully utilised in the summer peak. Heathrow also scores much better in terms of connectivity due to the nature of its route network, with a huge long-haul operation and a short-haul network that is well optimised to provide connections to it. Only 32% of the potential connections at Heathrow are lost due to the circuity threshold.
| Airport | Flights | Connections | Lost to circuity |
|---|---|---|---|
| LHR | 660 | 41,275 | 32% |
| LGW | 358 | 18,654 | 44% |
| STN | 245 | 9,344 | 61% |
Stansted is at the other end of the spectrum, specialising in short-haul point to point flights. It only has flights to four long-haul destinations: Amman, Dubai, Sharm el-Sheikh and Tel Aviv. These are all in the Gulf region and very few European travellers would ever contemplate connecting via London to get there. In fact the vast majority of Stansted’s flights go South and East, taking UK citizens to the sun and beaches. A full 61% of theoretical connections are lost due to the 1.5 circuity threshold.
When Gatwick’s recently approved second runway opens, one might think that would allow the airport to contemplate developing itself as a connecting hub. But the second runway is only estimated to add an additional 35% to flight volumes, due to operational restrictions. The quadratic maths of networks could turn that into an 82% increase in connections, but that would still leave it short of even today’s two runway Heathrow. Gatwick would also need to radically shift the profile of its network, in particular developing a lot more long-haul flights going West. it seems much more likely to me that the airport’s plans will be centred on stealing back market share from Stansted on leisure flights to the Med.
Final thoughts
I started looking into this topic mainly to work out what was going on in with the surprising rankings from OAG. My own analysis gave me rankings which were much closer to what I was expecting.
However, this work did reinforce for me what an amazing job is being done in Turkey with the Istanbul hub. The combination of location, fantastic infrastructure and a lead airline, airport and government working together to develop Istanbul’s hub potential is delivering world beating results.
It also helped reinforce how important the third runway is for Heathrow’s position. The OAG analysis suggested that LHR is holding onto a number one position as a global megahub. My figures show that it has already fallen to third place for long-haul connectivity and without another runway, that position is almost certain to decline further over time as other airports grow their flight volumes and networks.
Adding runway capacity at Gatwick will help fulfil point to point demand from the London area, but it will do very little if anything for the UK’s competitive position in the broader connecting market, something that ultimately supports the depth and breadth of the long-haul route network that links London and the UK to the world.