
A performance comparison of the European LCCs
Revisiting an analysis from 2020
Back in October 2020, I looked at the relative performance of the big three European low-cost carriers in this article. In particular, I tested the claims of both Ryanair and Wizz to have the lowest unit costs. For the year to March 2020, the last pre-pandemic period, Wizz had the lowest cost per ASK but Ryanair had the lowest cost per seat. However, adjusting for stage length differences and average fuel prices paid (which is very influenced in the short term by hedging policies), I concluded that the two carriers looked pretty much identical. easyJet’s unit costs were about 50% higher, although it managed to mostly compensate for that difference with higher unit revenues, with a greater focus on primary airports and business traffic than the other two.
Since then, it has been difficult to make meaningful comparisons, with activity levels depressed due to the pandemic. That was still true in the most recent reporting periods up to March 2022, with Omicron and Ukraine related cancellations still weighing on the results. However, I do think it is time to make an attempt to see how the three carriers are emerging from the crisis and to see whether any of the conclusions I drew back in 2020 have changed.
Profitability comparisons
Let’s start with a look at the bottom line performance. I’m focusing on profit before tax and exceptional items. Although when I say “profit”, I mostly mean loss of course. Anyway, here is a chart of the rolling annual profit going back to September 2019.

Of course, comparing the absolute profits and losses is a bit of an apples to oranges comparison, due to size differences. Normally, those are adjusted for by looking at profit margins, which divide the profit figures by revenues. But there hasn’t been much revenue during the crisis so those ratios have looked pretty whacky. I think adjusting by the size of the fleet is a better approach, which is what I’ve done in the chart below.

Source: Company reports, GridPoint analysis
What you can see from this chart is that pre-crisis, the performance of Wizz was very strong, but things have not been looking so great since then, with the company falling to last place on this metric in the most recent six months.
Conversely, Ryanair’s performance during the crisis stands out - it has done a far better job of containing losses than either of the other two and seems to be sustaining that outperformance as activity ramps up again. Even if we focus purely on the most recent quarter, you see the same pattern.
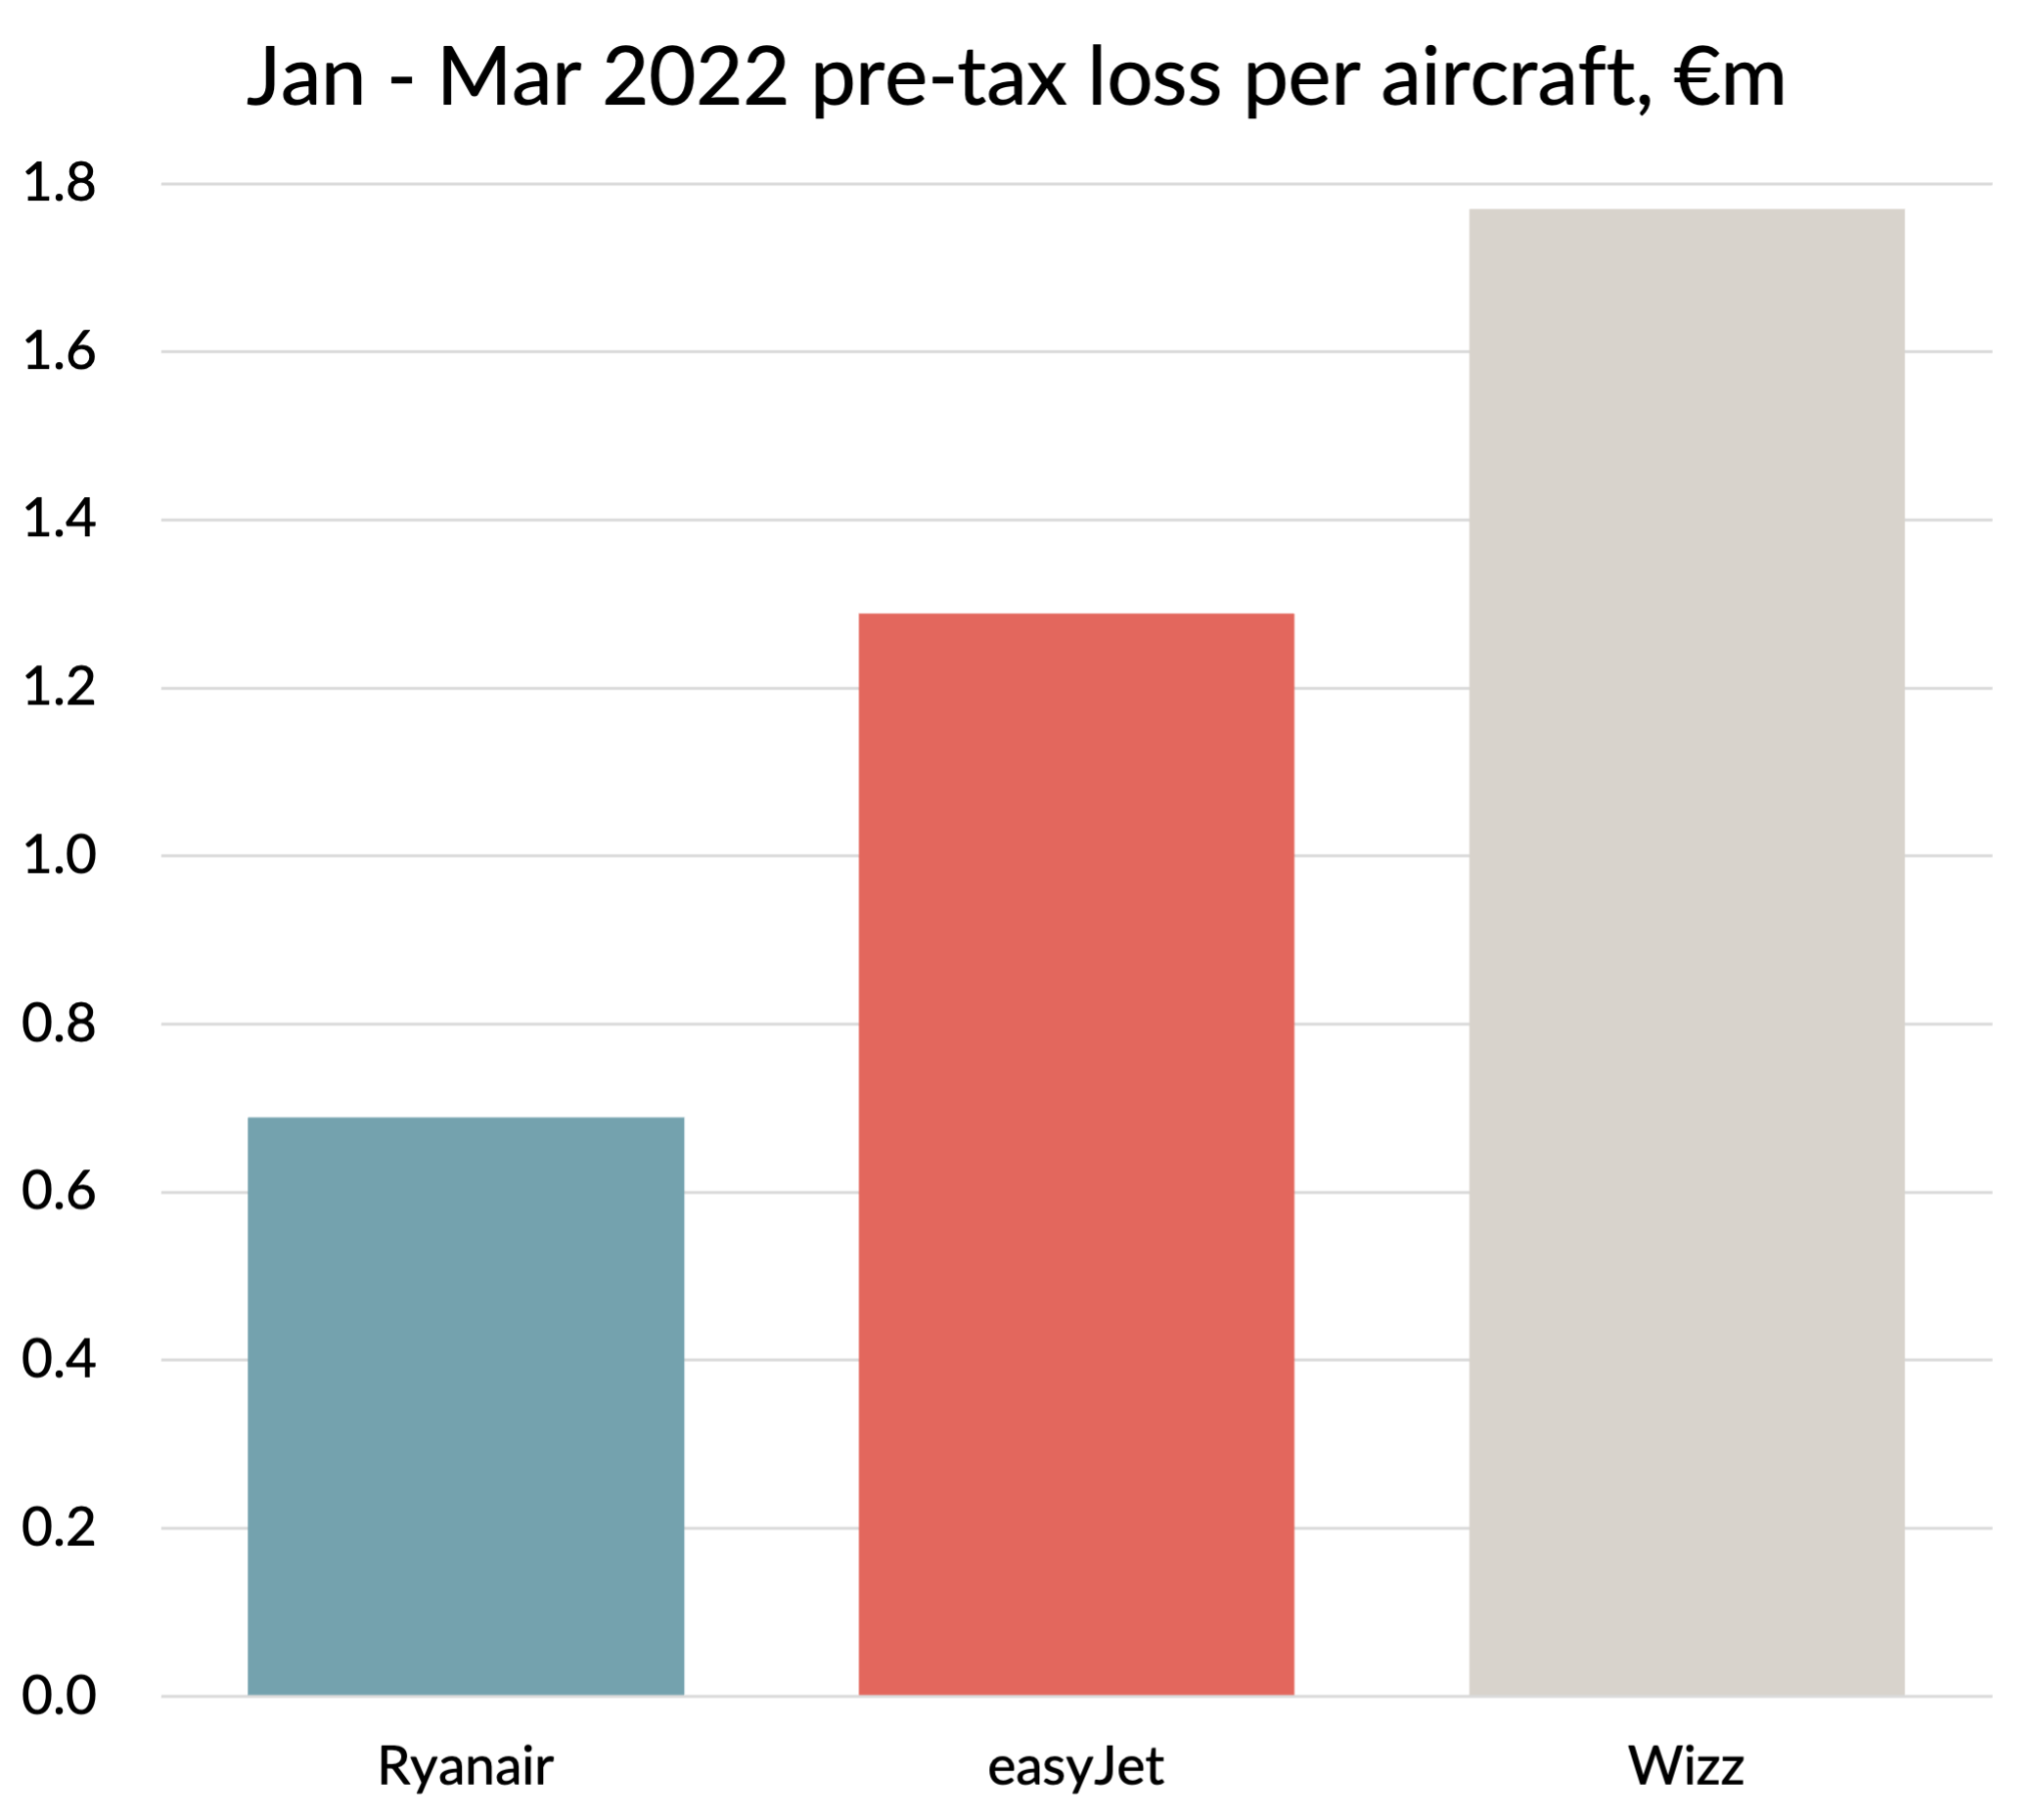
Source: Company reports, GridPoint analysis
Let us dig down into the figures for the 12 months to March 2022 to see if we can see what is driving the difference in performance. Since unit costs are the foundation stone of this business model, we’ll start there.
Unit costs for the 12 months to March 2022
In the chart below, I’ve shown the unit operating costs for the three airlines for the most recent 12 month reporting period. I’ve had to make some assumptions using other data sources to get Ryanair’s ASK figure - it is something they only publish when they release their full annual report for the year. But it shouldn’t be far out.
I have made the same adjustments that I did in my article from 2020 to try to get to an “apples with apples” comparison. The main one is to normalise for stage length since, all other things being equal, cost per ASK falls with distance. For the period in question, Ryanair and easyJet’s stage lengths were very close, but Wizz’s was 34% longer. I used the “square root” methodology to adjust all the figures to Ryanair’s stage length, which increases Wizz’s figures by 16%.
The other adjustment I made is to normalise the fuel price. Ryanair and easyJet’s average fuel cost per tonne only differed by about 1%, but Wizz’s was 27% higher due to their decision not to hedge fuel. By my calculations, that cost them €138m in the year, or almost €1m per plane.
Before the pandemic, WIzz and Ryanair were almost identical on this unit cost measure, but Ryanair has now opened up an 11% advantage. easyJet was 50% higher than the other two in the year to March 2020, and the gap has expanded further. Its unit costs are now a whopping 85% higher than Ryanair.

Source: Company reports, GridPoint analysis and estimates
The following chart shows the adjusted cost per ASK figures broken out by cost category. Wizz lumps en-route charges with airport and handling costs. I’ve split them out by assuming their route charges are in line with Ryanair, adjusted for the differences in the Maximum Take-off Weight (MTOW) of their fleet, which is how these charges are calculated. Their aircraft are slightly bigger and heavier than Ryanair’s.

Source: Company reports, GridPoint analysis and estimates
Unsurprisingly, cost categories like route charges and fuel come out looking very similar for all three companies. There isn’t much scope for differentiation there (at least once you eliminate the effect of fuel hedging, as I’ve done). The impact of Wizz’s newer and slightly larger gauge fleet does come through in the fuel cost line and they also seem to be getting a benefit in maintenance costs compared to easyJet. But they pay something of a price in higher depreciation costs.
easyJet stands out as highest cost across the board. Its business model is more focused on primary airports and you can see the impact of that in airport and handling charges. It spends a lot more on marketing and distribution too. But the most striking difference is in the area of staff costs, where its costs are triple those of Ryanair and Wizz. Some of that is probably accounted for by flying less than the other two did during the year. You can get a feel for that effect by looking at the average aircraft utilisation during the period, shown in the next chart. None of the airlines flew close to the levels they did before the pandemic, but easyJet is the furthest away, with aircraft utilisation 48% below pre-pandemic levels.

Source: Company reports, GridPoint estimates and analysis
The final observation I’ll make on the cost comparisons by type is to call out how much lower Ryanair’s reported depreciation and maintenance costs are compared to the others. These are areas which are both heavily affected by accounting policies and also by deals with the aircraft manufacturers. How much of Ryanair’s superior performance comes from more aggressive accounting, and how much from better deals is something we will probably never know. Suffice it to say that competitors have been puzzling over how they do it for many years.
Before I move onto revenue performance, I will take a quick diversion into the other big cost area, interest costs, which are “below the line” as far as operating cost and cost per ASK is concerned, but are very important for capital intensive airlines.
Interest costs
A large part of what appears on the profit and loss account as “interest” actually relates to aircraft leases. The accountants split the lease costs between depreciation and interest. They also fiddle with the timing profile of how the lease costs are charged to the profit and loss account over the life of the lease, but I don’t have space to go into that here. The main point is that Ryanair owns almost all of its aircraft outright, with very little associated debt, and at the other extreme, Wizz leases almost all of them. easyJet is somewhere in the middle. That shows up in higher financing costs for Wizz. Much higher, as you can see from the next chart.

Source: Company reports, GridPoint analysis
By itself, this difference accounts for 30% of the gap in loss per aircraft between Ryanair and Wizz.
Revenue
The one area where easyJet has always outperformed the other two is unit revenues. Before the pandemic, it managed stage length adjusted revenue per ASK (RASK) which was 40% higher than the other two. For the 12 months to March 2022, the company extended that advantage, with adjusted RASK 54% higher than Ryanair. Wizz and Ryanair were within 2% of each other, with Wizz having the edge.

Source: Company reports, GridPoint analysis
Part of the reason WIzz comes out a bit better than Ryanair is due to its superior ancillary performance. 56% of Wizz’s revenue comes from ancillaries, compared to 45% at Ryanair. It gets much higher ancillary revenue per passenger, although Ryanair almost fully compensates with higher ticket revenue per passenger. Even easyJet beats Ryanair’s ancillary revenue per passenger, although its much higher average fare means that it make the lowest percentage of revenues from that source.

Source: Company reports, GridPoint analysis
Overall assessment
There is not much to choose between Ryanair and Wizz when it comes to cash unit costs and unit revenues. Whilst there are some differences in individual cost categories and they achieve their revenues with a different mix of ancillaries and fare revenue, overall the performance is remarkably close. Ryanair has the edge on costs and Wizz has the edge on revenue thanks to its superior ancillary performance. Wizz did end up with €1.3m more revenue per aircraft, since it flew its fleet at a higher average utilisation during the year.
All the other big differences are in Ryanair’s favour, leaving Ryanair with over £3m per aircraft lower losses in the year to March 2022. This is more than explained by differences in fuel hedging policy and aircraft ownership / financing costs. Fuel price accounted for almost €1m per aircraft. Depreciation costs were around €1.5m per aircraft lower and interest costs were over £1m per aircraft less. Although Wizz has started to resume fuel hedging and Ryanair’s low priced hedges will begin to unwind over time, I can’t see these differences disappearing any time soon.
easyJet remains the odd man out of the three, which much higher unit revenues and much higher unit costs. If anything, the differences have widened since before the pandemic. Part of that is because it has been slower to restore capacity, but a lot is riding on the coming summer season as the airline ramps its operations back up. Of the three, it has been having the biggest operational problems. With a desperate need to get its revenue machine firing on all cylinders again, that’s the last thing the company needs right now.