
The battle of the low cost carriers

Claims and counter claims from Europe’s three biggest low-cost airlines
Europe’s three biggest low-cost carriers, Ryanair, easyJet and Wizz are not just competing for passengers. They are also fighting to convince investors that they will be the winners coming out of the pandemic. Support from investors will be crucial for any airline which wants to take an aggressive approach to winning share during the crisis, something all the low-cost carriers believe that they can do.
For example, easyJet claimed recently that:
“[easyJet] is well positioned to weather the ongoing challenging environment and capitalise on a recovery, once government travel restrictions are eased.”
Wizz CEO József Váradi has been even more bullish about their prospects:
“As the lowest cost producer operating the youngest and most efficient fleet of aircraft, we are best positioned to double down on the opportunities that present themselves…. I believe Wizz Air will emerge as a structural winner post-COVID-19.”
I decided to take a closer look at these three airlines. In particular, I want to test Wizz’s claim to be the lowest cost producer. That is something that Ryanair would certainly contest, describing themselves as “Europe’s lowest cost airline group”.
Although I am going to focus on these three carriers, I thought I should start by looking at where they fit in the broader intra-European market.
Intra European capacity shares
The following chart shows the largest carriers in terms of seat capacity for intra-European flying. OAG defines Europe fairly broadly, in particular it includes Turkey and Russia, which is why S7, Aeroflot, Turkish and Pegasus make an appearance on the list.
I’ve shown the figures for the 12 months to March 2020, the last period which was mostly unaffected by COVID capacity reductions. The red coloured bars are for the carriers that position themselves as “low-cost”.

Source: OAG, GridPoint analysis
After the “big 3” low-cost players, the next two biggest low-cost airlines are both part of larger airline groups. Vueling is part of IAG and Eurowings is part of Lufthansa Group. If you add up all the intra-European capacity operated by the three big network carrier groups, you get a clear “big 5”, which between them account for just under 50% of all intra-European capacity. Looking only at Western Europe would give even higher capacity share figures for these five companies.

Source: OAG, GridPoint analysis
Ryanair, easyJet and Wizz compared
So having put things into context, let us get back to comparing Ryanair, Wizz and easyJet. The first two position themselves as “ultra low-cost” carriers, whilst easyJet is more of a hybrid carrier, with a stronger focus on business passengers and generally flying from main airports.
Ryanair and Wizz both claim to be the lowest cost operator, so let us see what the data tells us.
Overall unit costs
I have analysed the figures for all three carriers for the twelve month period ending March 2020, which will give us the “pre COVID” perspective.
It is important to understand the differences in average stage length when making such comparisons. As flight distance increases, cost per passenger or per seat will go up, but cost per available seat kilometre (ASK) will decrease. This matters because stage length is quite different for these three carriers.

Source: company reports, GridPoint analysis
It is no surprise that in their mission to convince investors that they are the lowest cost airline, Ryanair focuses on cost per passenger / seat and Wizz highlights cost per ASK.
I’ve adjusted the headline cost per ASK figures using an industry standard stage length adjustment of the square root of the stage length, which should give a fairer comparison.
The other adjustment I have made is to the fuel costs. Airlines adopt different approaches to hedging and so the average fuel price they pay in any given period can vary. Sometimes analysts look at unit costs excluding fuel to try to eliminate this distortion, but that approach also misses out the important differences in fuel efficiency of the aircraft they each operate. All three airlines give figures for their average fuel price, so I have adjusted the figures to bring everyone into line with Ryanair.
After making these two adjustments, these are the results I get for the 12 month period to March 2020.

Source: company reports, GridPoint analysis
The winner on an “apples with apples” basis is Ryanair, but only by about 1%. So pretty much a dead heat.
easyJet’s unit costs are just over 50% higher than the other two. Where does this difference come from?
Unit cost comparisons by cost category
To try to understand what lies behind these differences, I’ve looked at the breakdown of costs that each provides. The cost categories that each report line up pretty well, but I’ve had to make a couple of adjustments to get comparable figures.
easyJet doesn’t report a figure for total staff costs, it only provides “crew costs”. I’ve estimated the non-crew employee costs using headcount data from last year, assuming that the average cost per employee is the same.
The next problem is that Wizz amalgamate “routes charges” with “airports and ground handling” costs. I’ve split these out using an estimate for route charges based on Ryanair’s cost per sector, adjusted for differences in the two airlines’ fleet and stage length.
Here are the figures, once again adjusted for stage length and fuel price. The stage length adjustment should probably vary by cost category, but you have to stop somewhere.
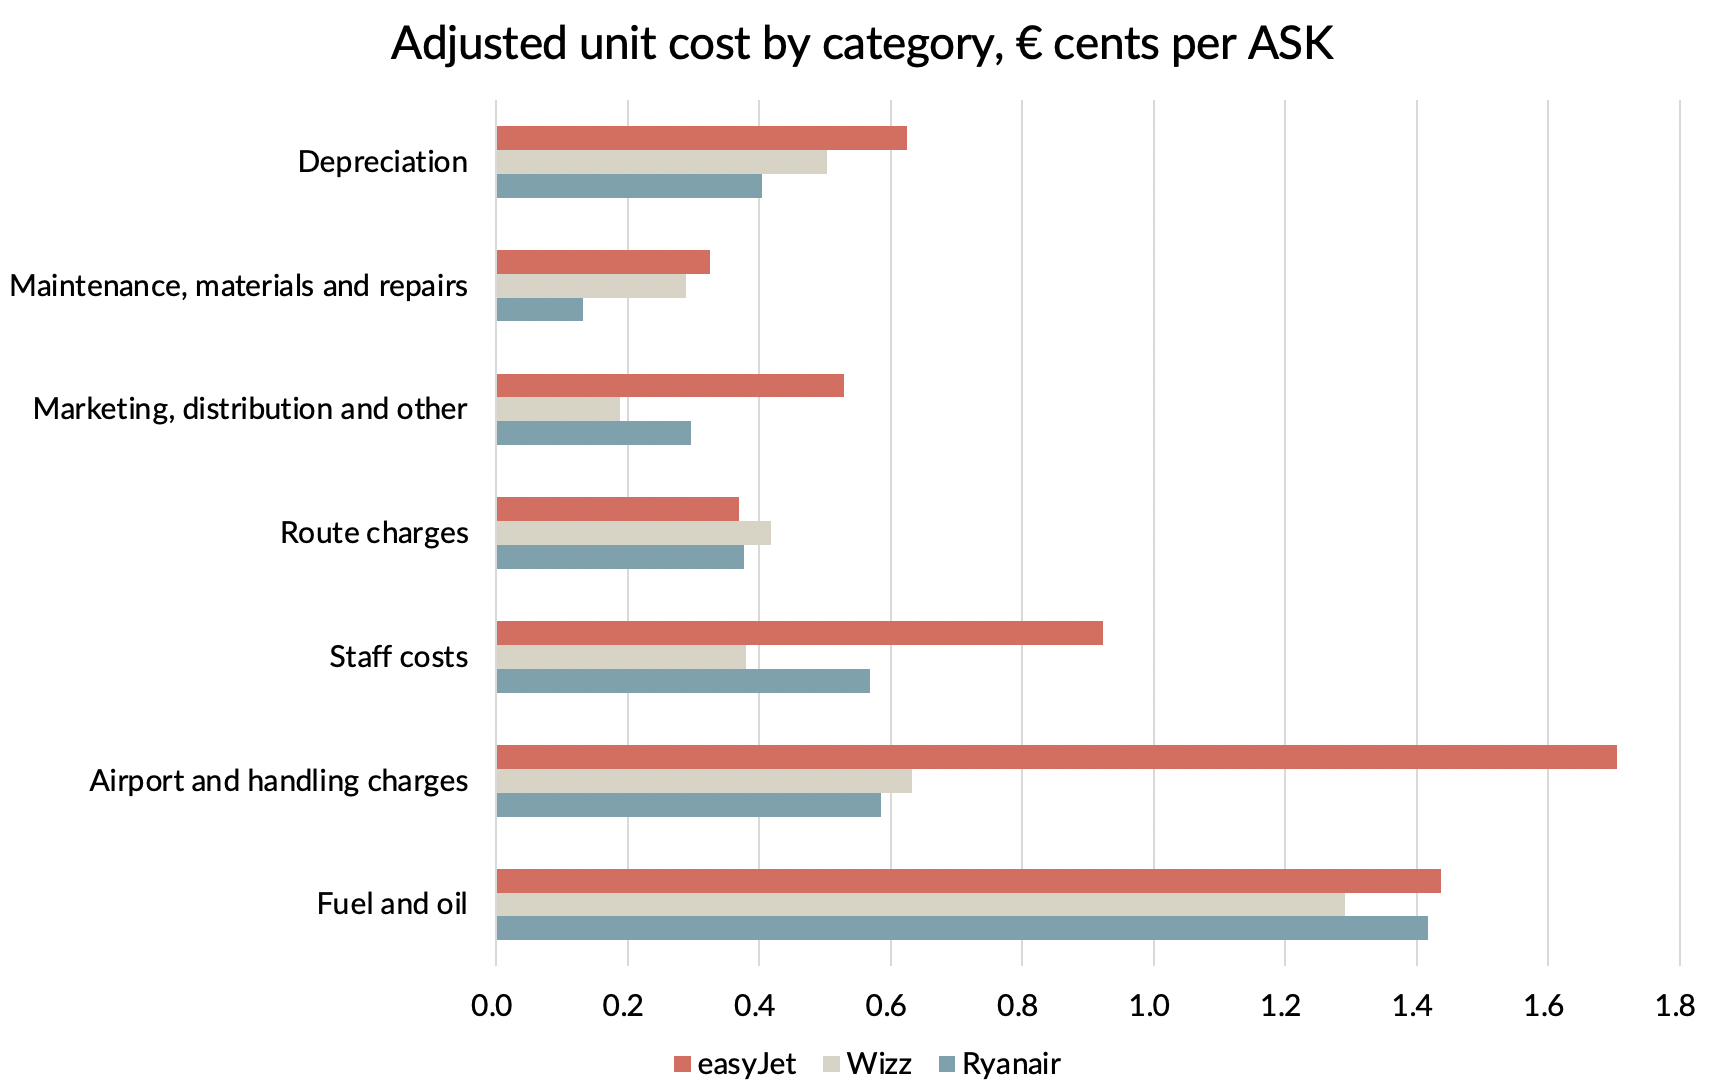
Let us now try to see if we can explain some of these differences, starting with the biggest gap.
Airport and handling charges
The most striking difference between easyJet and the other two airlines is in airport and handling costs and this category accounts for over half the unit cost gap.
In part that reflects their different strategies, with Ryanair and Wizz both making significant use of cheaper secondary airports, whilst easyJet focuses on main airports.
From a cost competitiveness standpoint, this should be less of a concern - where easyJet competes head to head on the same airport pair, you would not expect to see so much of a difference.
Staff costs
Of more concern for easyJet is the difference in staff costs, which is the second biggest driver of the cost gap, accounting for about 20% of the overall unit cost difference to Ryanair.
Ryanair are famously aggressive in their employment practices and Wizz makes heavy use of Eastern European labour, so perhaps it is not a surprise that average cost per head is highest at easyJet.

However, easyJet also do poorly on crew productivity, with block hours per crew member 23% worse than Ryanair and 30% worse than Wizz. With a six person crew (two pilots plus four cabin attendants), the theoretical maximum that could be achieved within EU limits of 900 hours per head would be 150. Wizz achieve an impressive 84% of that, whilst easyJet only manage 59%.
That is really poor.

Aircraft driven costs
Pervading all the unit cost differences is average aircraft size, with easyJet on average flying the smallest aircraft and Wizz the biggest. Larger aircraft drive lower unit costs. Flying smaller aircraft allows easyJet to offer higher frequency for any given capacity level on a market, which should also drive higher revenues, especially from business passengers in normal times.

Another compounding factor is aircraft utilisation. As well as directly driving unit costs for aircraft ownership, poor aircraft utilisation also tends to drive poor crew productivity and higher unit maintenance costs. At only 9 hours per day, easyJet’s utilisation is poor for a low-cost carrier.

Revenue differences
As we have seen, there are many areas where easyJet incurs higher costs as a result of its different business strategy. In every case, there is a logic as to why the different choices it has made should drive higher revenues. But did easyJet manage to deliver unit revenue premiums which compensate for its compromises on unit cost?
Well, almost. Looking at revenue per ASK, adjusted in the same way for stage length, shows that easyJet got 40% higher unit revenues than Ryanair in the year to March 2020.
But remember that unit costs were 50% higher.

The bottom line
Given what we have seen, it won’t be much of a surprise to hear that going into the crisis, easyJet’s margins were trailing those of its two big low-cost competitors.

Did this represent a flawed strategy, or failures in execution?
My personal opinion is that it was a mixture of both. Undoubtedly easyJet should have controlled costs better. The efficiency gap on key metrics seems more than can be explained by business model differences alone. But the company has also strayed quite far from the low-cost “playbook” and that wasn’t paying off even in pre-COVID times.
In the post pandemic market environment, with full service carriers and lower cost competitors both fighting hard for volume, there will be even less room for an airline which has positioned itself “in the middle”.
Share price performance
The market has certainly delivered its verdict, taking the view that a business model that is more reliant on business passengers and has much higher unit costs is not one they want to own in the new environment. easyJet’s share price has taken a hammering during 2020, losing 2/3 of its value.

Source: yahoo.com, GridPoint analysis. Ryanair share price converted to sterling.
Conversely, Ryanair’s and Wizz’s share prices have been seemingly immune to all the bad news on the pandemic front, having lost only 15-20% of their value in sterling terms.
Whilst I certainly agree that the two lowest cost players deserve a premium rating, they were already more highly valued than easyJet before the pandemic. Share price changes during 2020 now leave Ryanair with a market capitalisation of €13.3 billion, 5.5 times that of easyJet’s, for an airline that before the crisis was only 20% bigger in revenue terms and had similar balance sheet ratios. To be fair, Ryanair’s post-tax profit was 2.3 times that of easyJet, but that still implies that the market is expecting the performance gap to widen significantly going forward.
Is that too big a valuation gap?. And if it is, should easyJet’s shares be higher, or do Ryanair’s and Wizz’s valuations need to come back down to earth?
Performance so far during the crisis
Results so far do seem to show that passenger volumes have been more resilient at Wizz and Ryanair than at easyJet, but the difference is not huge.

Source: company reports, GridPoint analysis
Much of the difference seems to me to reflect decisions about how quickly to ramp up capacity, with easyJet prioritising load factor and Wizz going for volume. By September, the three carriers were converging.

In the April to June quarter, easyJet racked up the biggest losses, with about €360m before tax and exceptional items. The larger Ryanair kept losses on the same basis to €210m and Wizz’s €56m loss was better still, even adjusting for size (it is about 1/3 of Ryanair’s size on most metrics).
For the July-September quarter, so far we only know easyJet’s results. They managed to lose almost as much as in the previous quarter with losses of about €345m. When Ryanair and Wizz report their figures next month, we will know whether they have continued to keep losses substantially lower than at easyJet.
If they have, they will be making a good case to investors that they deserve their premium rating. if not, there doesn’t seem much room to me in their current valuations to allow for any disappointments.