
Comparing the fuel efficiency of the world’s airline fleets
By Juke Schweizer - Own work, CC BY-SA 4.0, https://commons.wikimedia.org/w/index.php?curid=79071899
Which airlines have the most fuel price resilient fleets?
Given what has happened to the price of jet fuel recently, I thought it would be a good time to reflect on how well placed all the airlines are in terms of the intrinsic fuel efficiency of their fleets.
The economic trade-off for airlines between flying older less fuel efficient aircraft and newer more fuel efficient types is more balanced than casual observers often think. Aircraft markets reflect fuel efficiency differences in ownership costs, and so a fuel efficiency difference would in the long-run be compensated by ownership cost differences. That is at least until the required ownership cost rate drops below zero, at which point the aircraft will be scrapped. However, that adjustment only happens when aircraft change hands or deals are renegotiated. In the short-term, ownership costs are fixed and so when fuel prices go up, a more fuel efficient fleet becomes a direct competitive advantage.
There are many aspects of fuel efficiency. Some of them are business model and network related - flying from congested airports will burn a bit more fuel for example. Seat density is very important when it comes to looking at fuel cost per seat. There isn’t much difference between the fuel required to fly an A320 with 180 seats compared to one with 165. If your chosen metric is fuel cost per passenger, load factors enter the picture. There are also operational practices that can shave off a fraction of a percentage here and there, such as taxiing with one engine and eliminating unnecessary weight (“do we really need to fill up the potable water tanks on every flight?”).
However, in this analysis I’m going to focus on the intrinsic fuel efficiency of the aircraft themselves. That’s a big driver of overall fuel efficiency and airlines spend billions of dollars chasing it. In this view of the world, an A320-NEO is an A320-NEO, regardless of which airline is flying it. I’ve started with data for each airline on the number of block hours flown by aircraft type, based on published schedules for calendar 2026. To that data, I’ve applied my best estimates of fuel burn per block hour to get a total fuel burn estimate. I’ve checked quite of few of these estimates against known totals for different airlines and get figures within 10%, so although the numbers won’t be perfect, they should give us a good indication.
My chosen output measure for calculating fuel efficiency is “seat-block-hours”. So flying 100 seats for one hour is equivalent to flying 50 seats for two hours. The seat count I’ve used for each aircraft type is based on my best estimate of an all economy configuration, and is the same regardless of airline operator. As I said before, I’m ignoring airline cabin configuration choices in this analysis. My efficiency metric is therefore “seat-block-hours per tonne of fuel burned”.
I’m going to do my comparisons separately for the wide-body and narrow-body fleets. By using all economy seat counts, I’ve got rid of one of the biggest distortion factors which make wide-bodies look expensive on a per seat basis. However, it is still the case that wide-bodies typically burn a lot more fuel than a narrow-body with an equivalent number of seats. The wider cross-section, which causes more drag, is one reason. That also gives a lot more belly space for cargo, but I’m not counting cargo capacity in my output measure. The other major issue is that wide-bodies are built for much longer range operations. That needs big fuel tanks and a lot more structure to cope with the extra weight. That’s one of the reasons that most airlines don’t normally fly wide-bodies on short flights, since is ruinously expensive compared to a narrow-body.
So with that preamble out of the way, let us start with the big birds, the wide-bodies. They make up only 21% of the global block hours, but according to my calculations, account for 44% of the total fuel consumed.
Wide-bodies
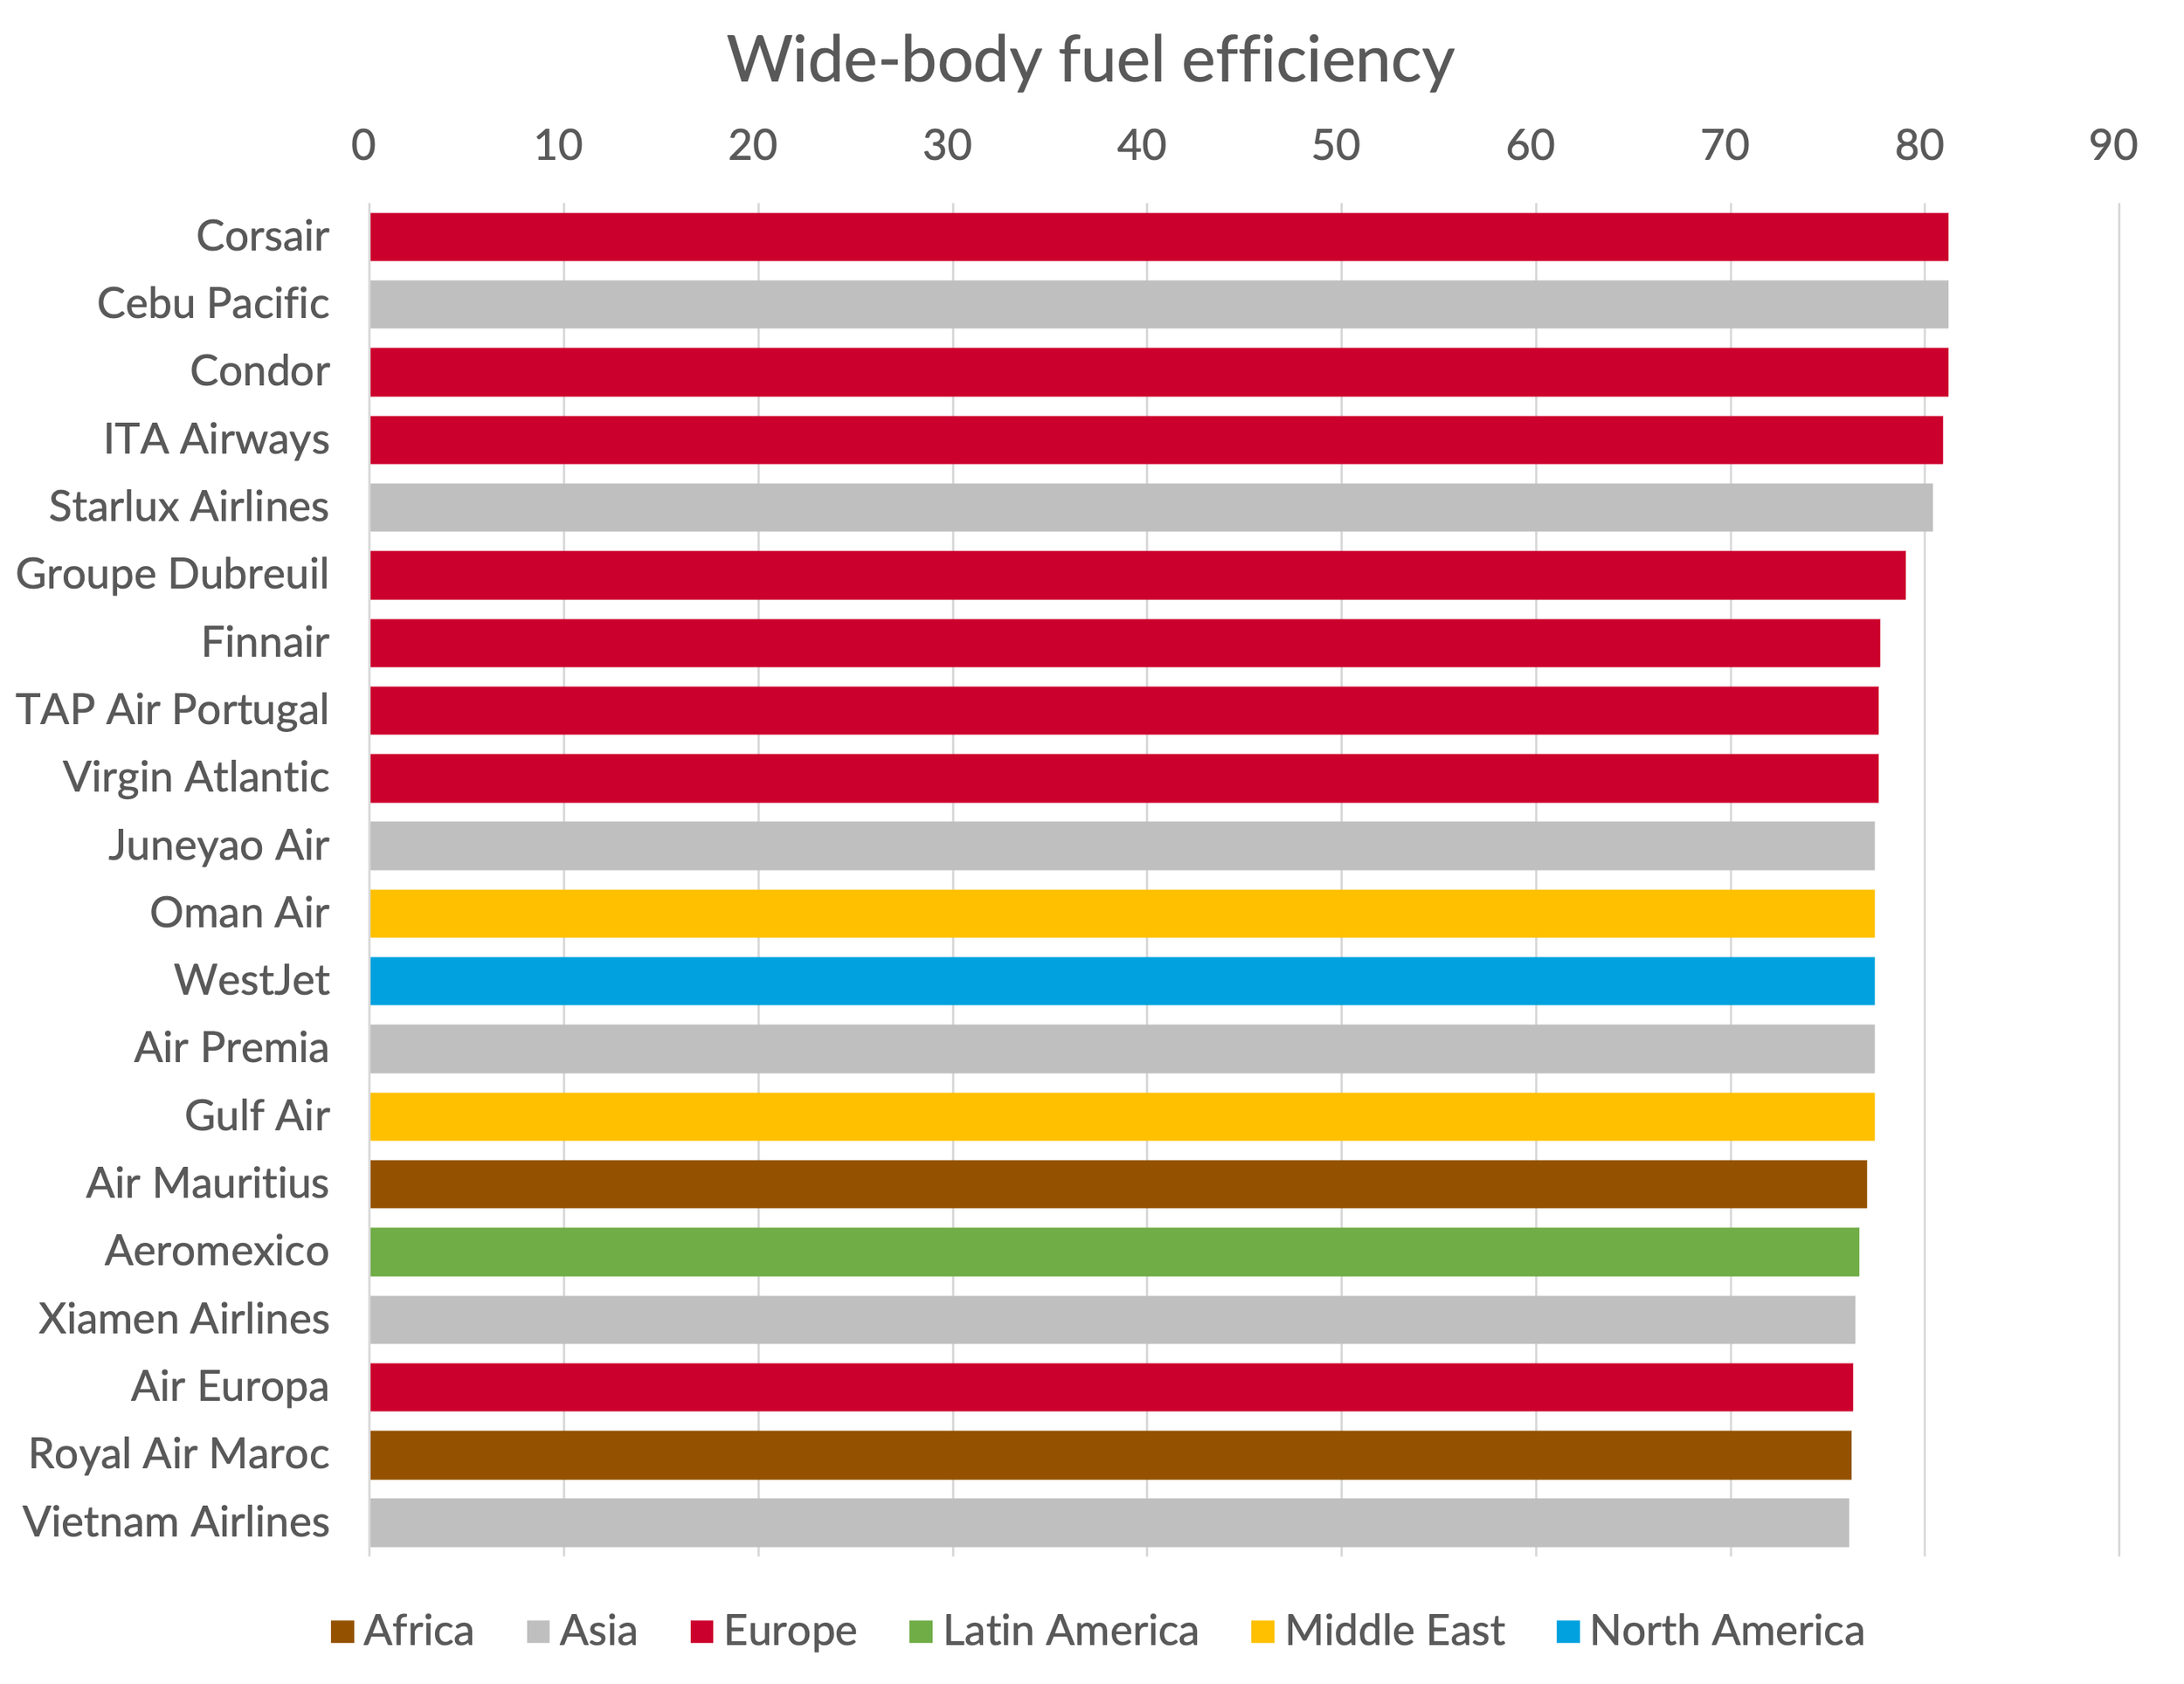
In the chart which follows, you will find the biggest wide-body operators in the world, ranked by fuel efficiency. I’ve colour coded the bars according to the region of registration of the airline group. The most fuel efficient operators are generally from the Middle East or Asia, with Etihad winning the top slot. They tend to have the newest fleets, often a by-product of faster growth. Emirates is an exception, finding itself at the bottom of the list due to its “all in” strategy on the A380, an aircraft which has fuel efficiency about 25% worse than the likes of the 787-10 or the A350-900.
Amongst the Europeans, Lufthansa sticks out as something of a laggard, with average wide-body fuel efficiency about 6% behind AF-KLM and IAG. With the exception of Delta, the US airlines also score quite badly. American and United are about 7% worse than Delta according to this measure.
Before the Iran war, fuel costs made up circa 20% of revenue, so a 6% fuel efficiency difference equated to about 1.2 points of margin. With fuel prices having doubled, the difference might now account for around 2.5 points of margin. The difference is still probably not of a size that could be called truly “strategic”, but it is perhaps getting there.
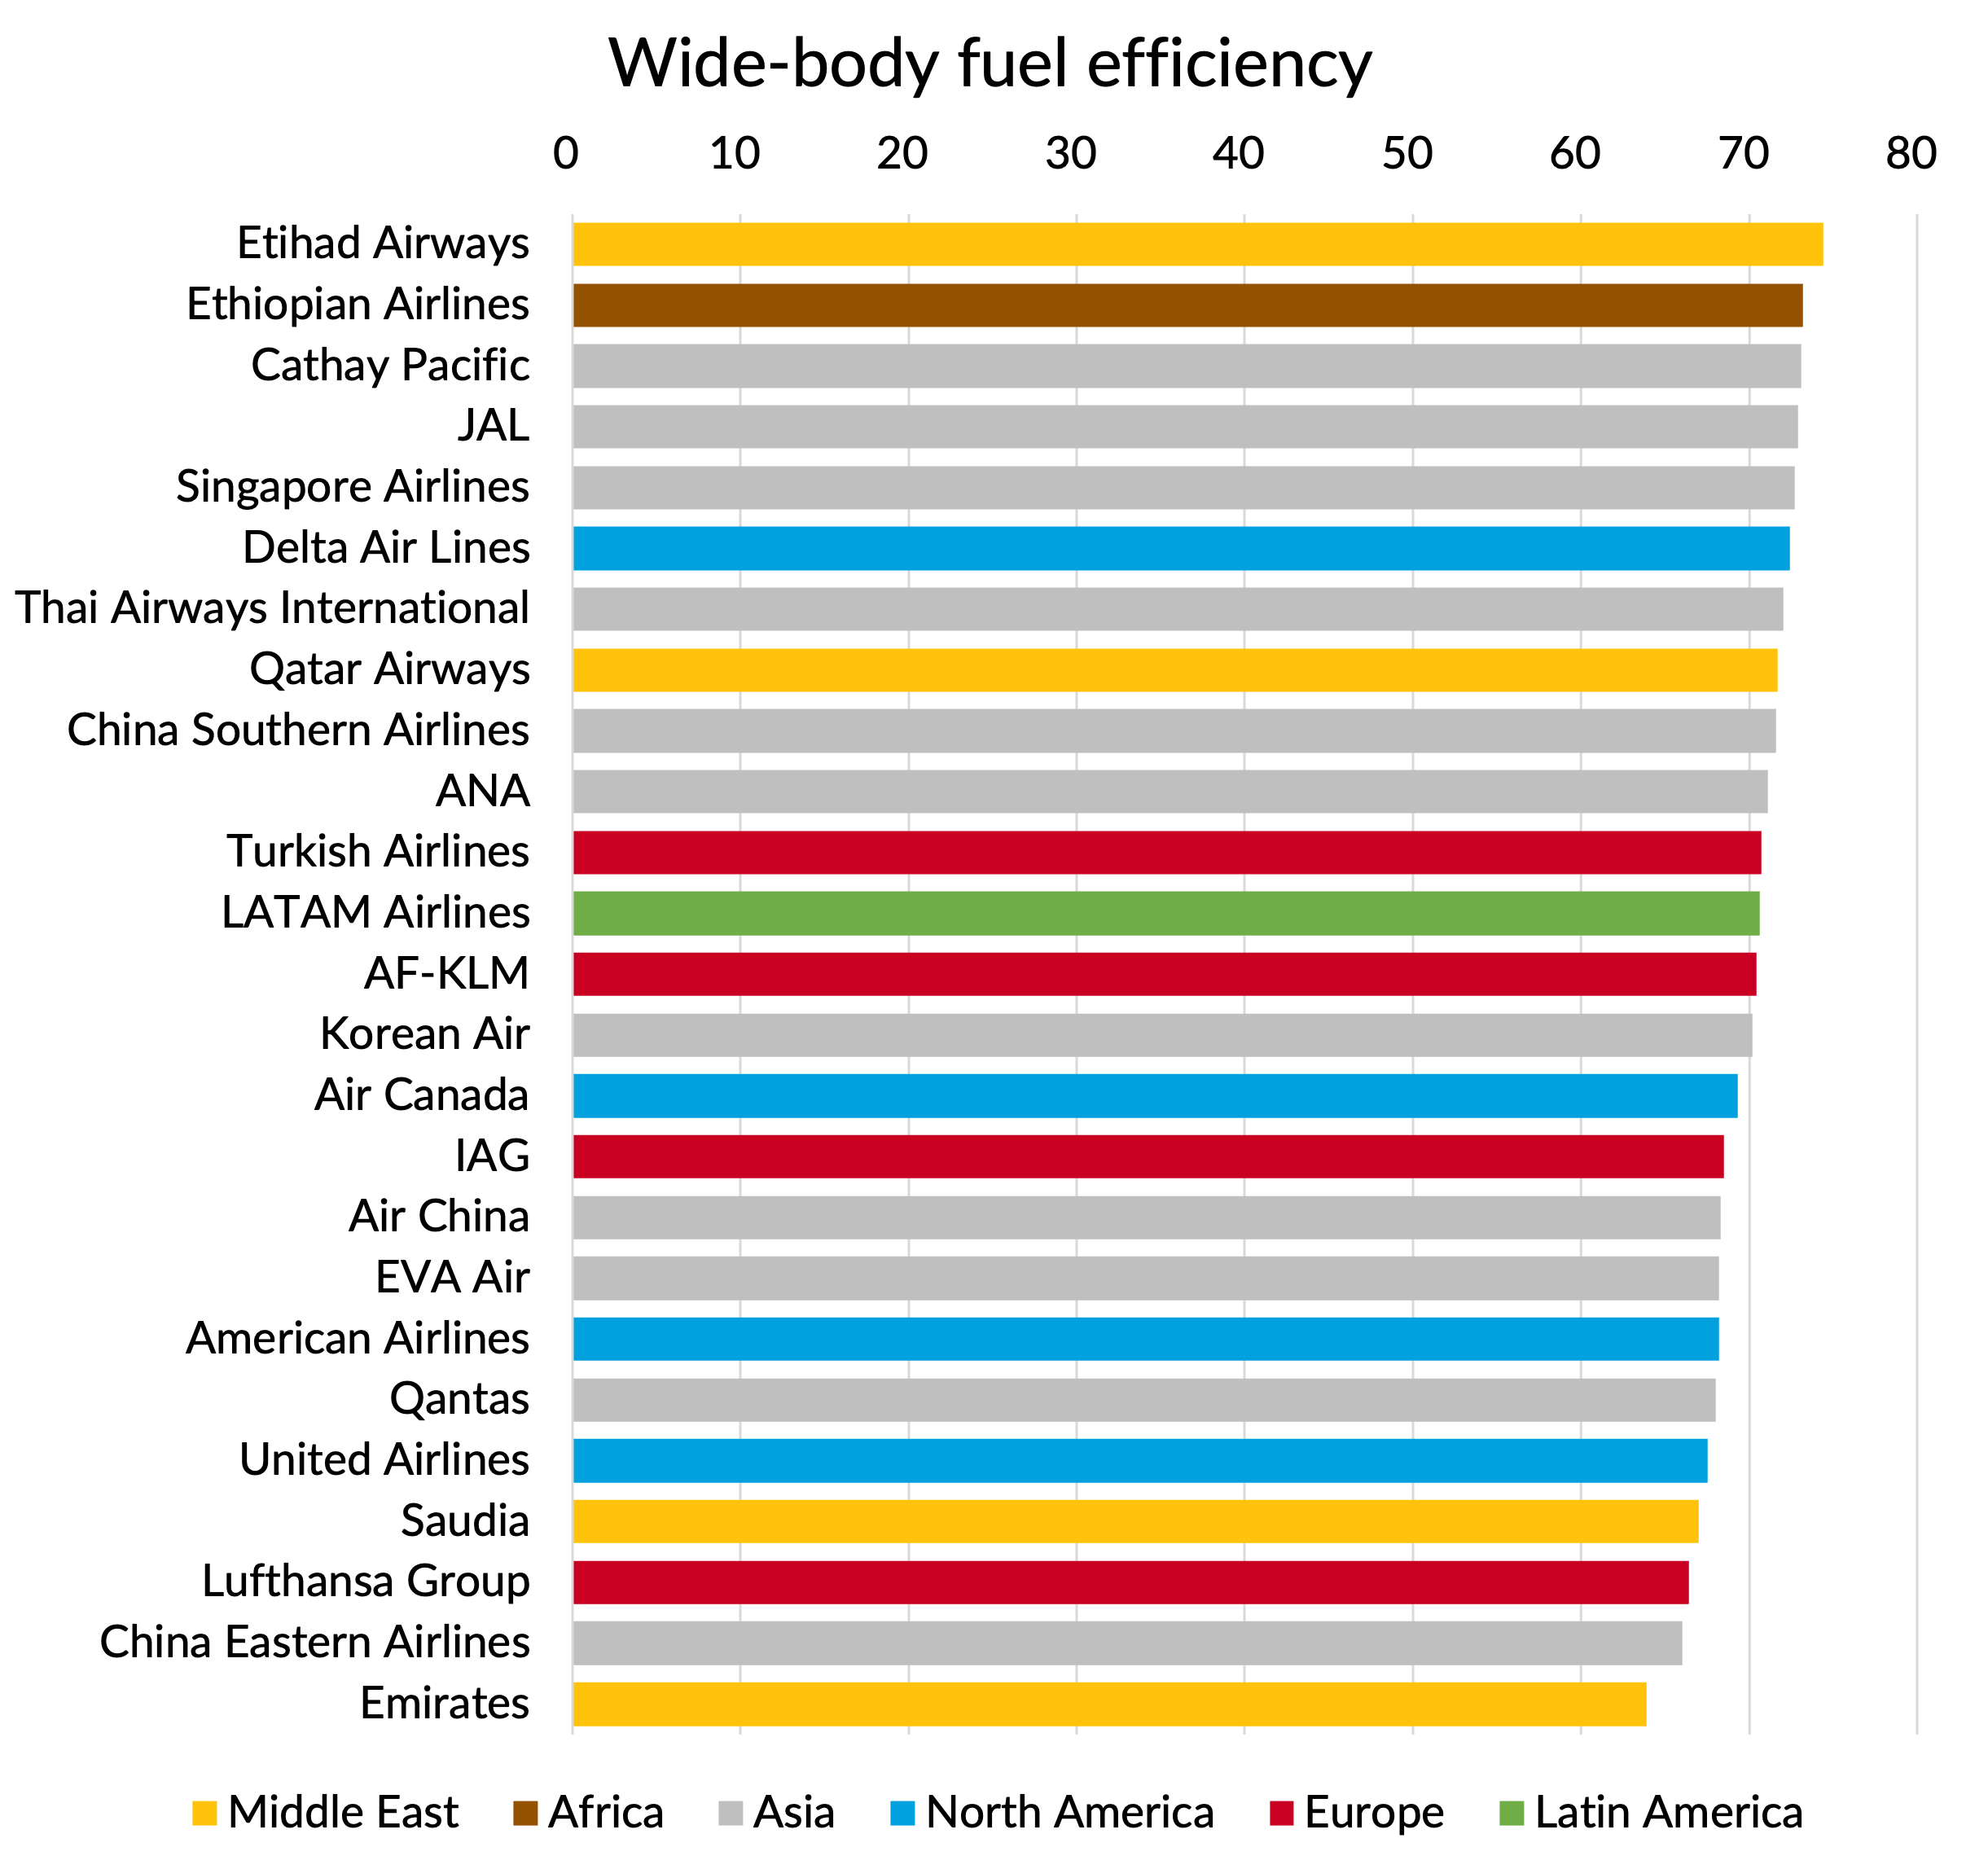
Source: Published schedule data for 2026 and GridPoint assumptions and analysis
Narrow-bodies
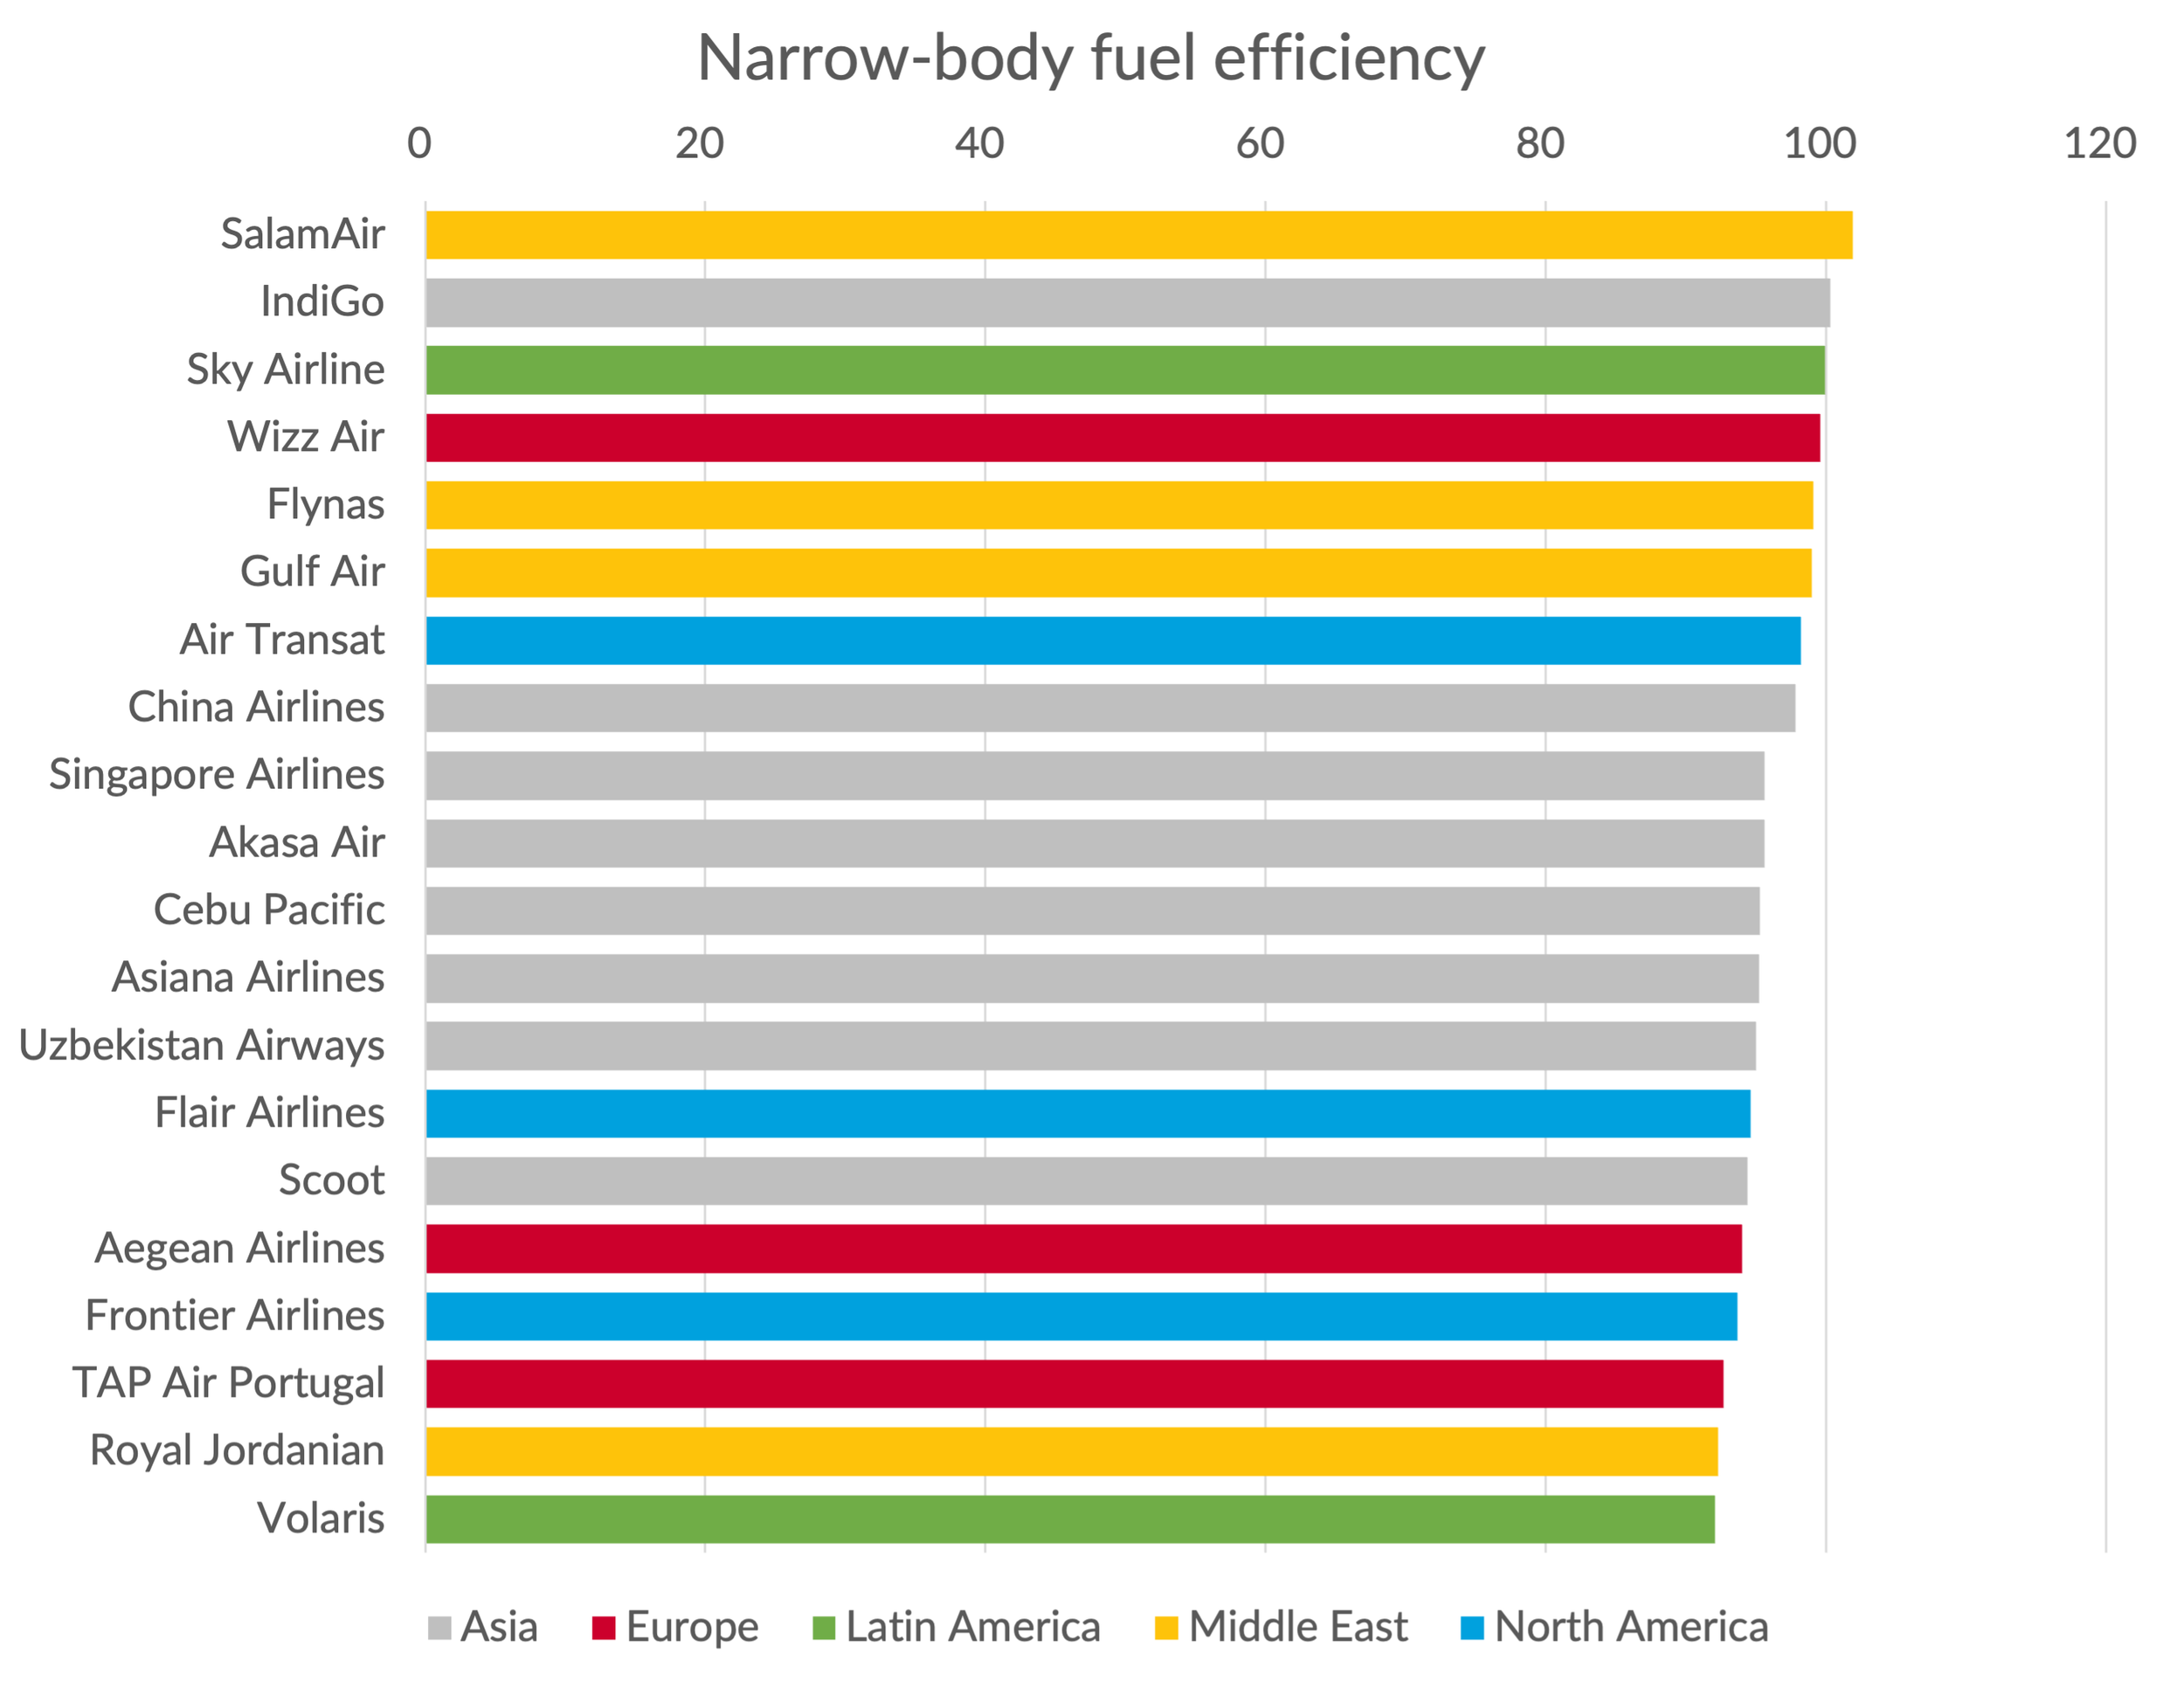
For the narrow-body category, I’ve included both regional jets and turboprops, since they do compete head to head with the larger narrow-bodies on many routes. There aren’t very many turboprops in the mix in reality, but the North American airlines make heavy use of regional jets and that does drag them down when it comes to average fuel efficiency, as you can see from the following chart.
Top of the pile are IndiGo and Wizz, who have a fleet consisting almost entirely of latest generation A320 and A321 NEOs. In competitive terms, Wizz has a 15% fuel efficiency advantage on Ryanair and EasyJet, through a mixture of aircraft size and a higher proportion of new generation equipment.
On this fuel efficiency metric, Ryanair and EasyJet aren’t materially better than IAG (2%) and Air France - KLM (4%). That gap would widen a bit if you included seat density and load factor in your efficiency metric. However, I don’t think there is that much difference these days on economy cabin seat density and load factors, so even on that basis I think this is less of a cost advantage than most analysts believe.
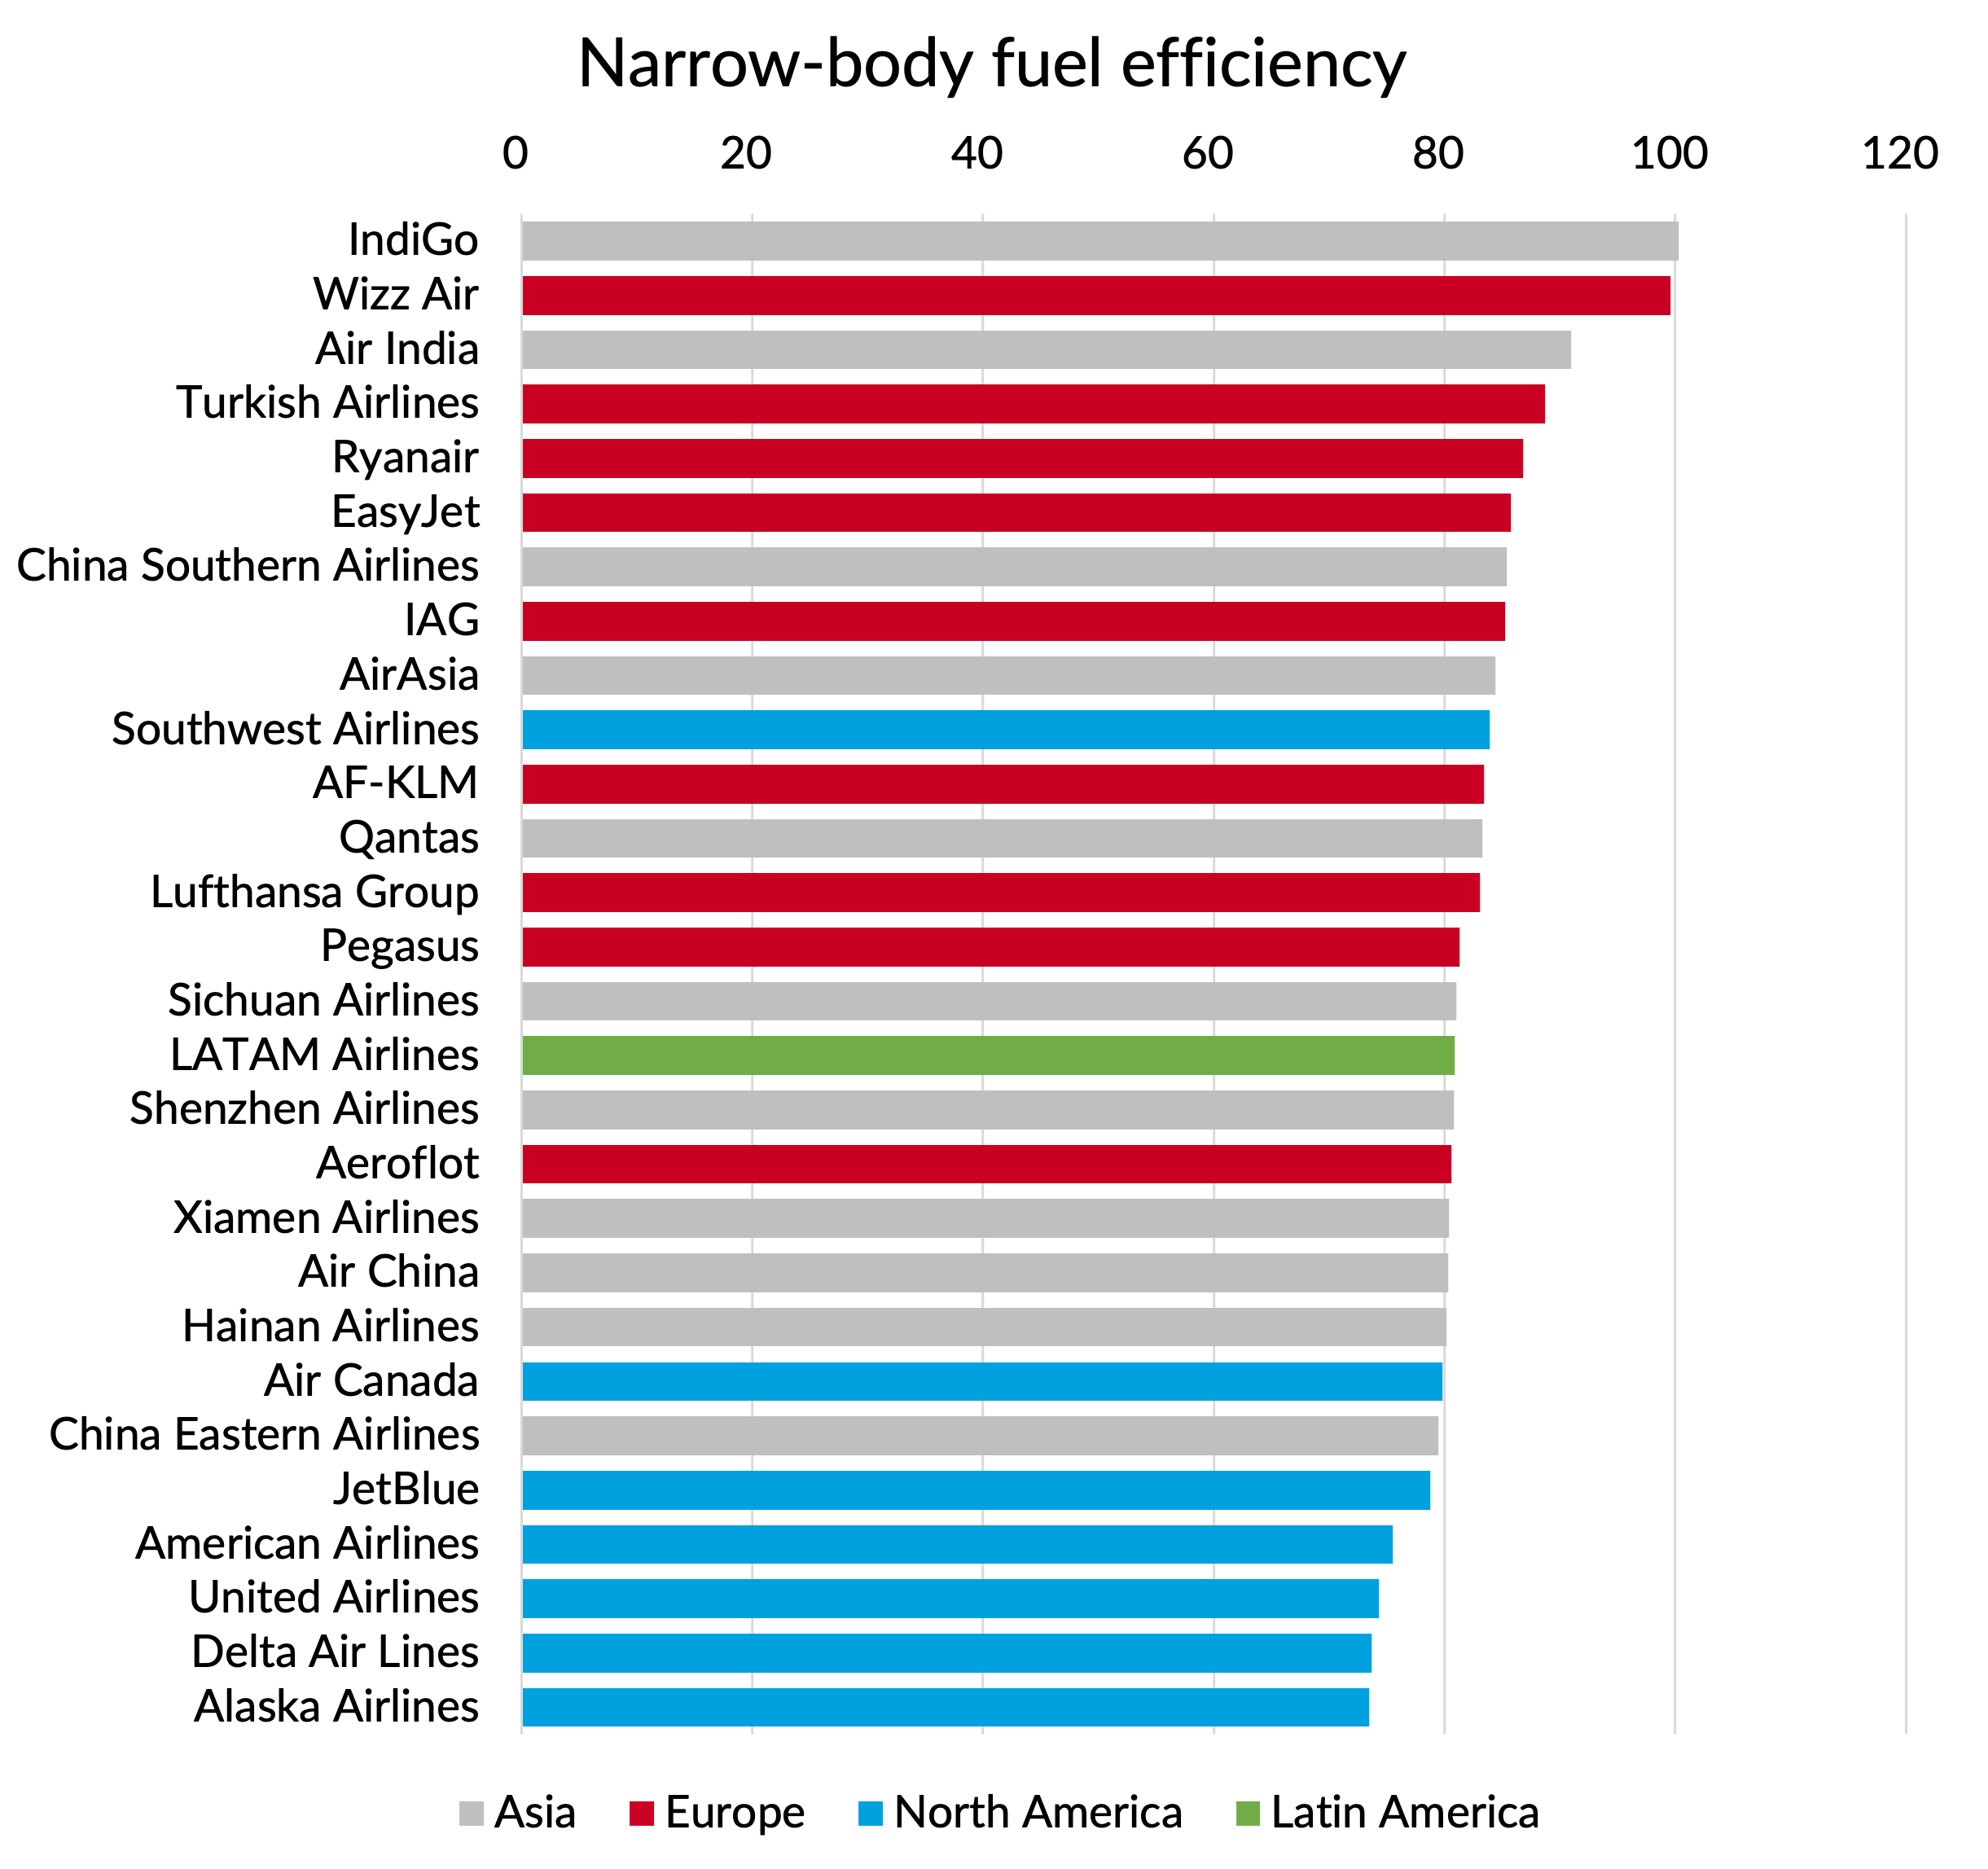
Source: Published schedule data for 2026 and GridPoint assumptions and analysis
A word about aircraft size
In general, flying bigger aircraft will improve fuel efficiency on a per seat basis. That’s one reason why concentrating traffic at hub airports is not as bad for emissions as some critics would imply. I wrote about that here if you are interested to learn more. It is not always true of course, as was famously the case with the A380. When it launched, it was only as good as the 777-300 ER which launched at the same time, despite being more than 50% bigger. This was one of the reasons it failed in the market. There were only a handful of markets where the extra size itself was a selling point - basically high density routes between slot constrained airports where there is no revenue advantage to adding frequency. One such example is LHR-HKG, where airport curfews at both ends basically give only one commercially attractive flight timing. The other application is regulated markets where frequency is restricted by government controls. I guess that Emirates had many of those and that was perhaps why they were so attracted to the aircraft.
Because of the usual fuel efficiency benefits to size, some of the differences we saw in the comparisons I just showed are down to differences in average aircraft size. Even in a high fuel price environment, flying smaller aircraft at high frequency can still be the better commercial decision for an airline. The revenue advantages of offering more flight timing choices to customers and making more connections can outweigh the fuel and other cost disadvantages. That’s one of the reasons that the US carriers make heavy use of regional jets. The other reason is the big saving they get on pilot costs due to lower pay rates for regional jet aircraft (the “scope clause” effect).
What happens in a high fuel price environment? Airlines are forced to raise prices, which dampens demand. The last thing you want in a low demand environment is bigger aircraft. So what I expect to see is accelerated retirement of any big, fuel-inefficient aircraft. There is also an effect at the smaller aircraft end. Where airlines were before happy to take the fuel efficiency hit of flying smaller aircraft due to other advantages, those plus points will remain unchanged whilst the fuel cost penalty will increase. So we are also likely to see a shake out here, with thin routes disappearing completely and frequencies on larger routes being cut, with demand consolidated onto fewer, more fuel efficient “mid size” aircraft.
Teasing out the aircraft size effect in the overall fuel efficiency comparisons
Any readers who aren’t aircraft nerds, and have inexplicably made it this far into the article, might want to skip this section. I’ve been through the main points I wanted to make and the charts and comparisons are going to get a bit more complicated.
Still with me? OK let’s try and tease apart the two effects driving the overall fuel efficiency numbers that I showed before: 1) the effect of aircraft size and 2) the effect of fuel efficiency at a given size point. The reason for doing this is to better understand the competitive dynamics. If my competitor is flying aircraft which are the same size as mine but are 10% more fuel efficient, I have an absolute cost disadvantage. If my competitor is flying aircraft which are 10% more fuel efficient than mine, but 20% bigger, I can fly six frequencies to their five without offering any more capacity and potentially get enough of a revenue advantage to offset the fuel cost disadvantage.
Let’s start first with the narrow-body comparison. In the next chart, the fuel efficiency figures for each airline are the same as we saw earlier, but I’m also showing where each airline sits in terms of average aircraft size. The sloping lines on the chart show what I would calculate to be equal-efficiency frontiers. Moving along the line changes fuel efficiency in accordance with what would be expected from aircraft size alone (see this earlier article for how I calculated these).
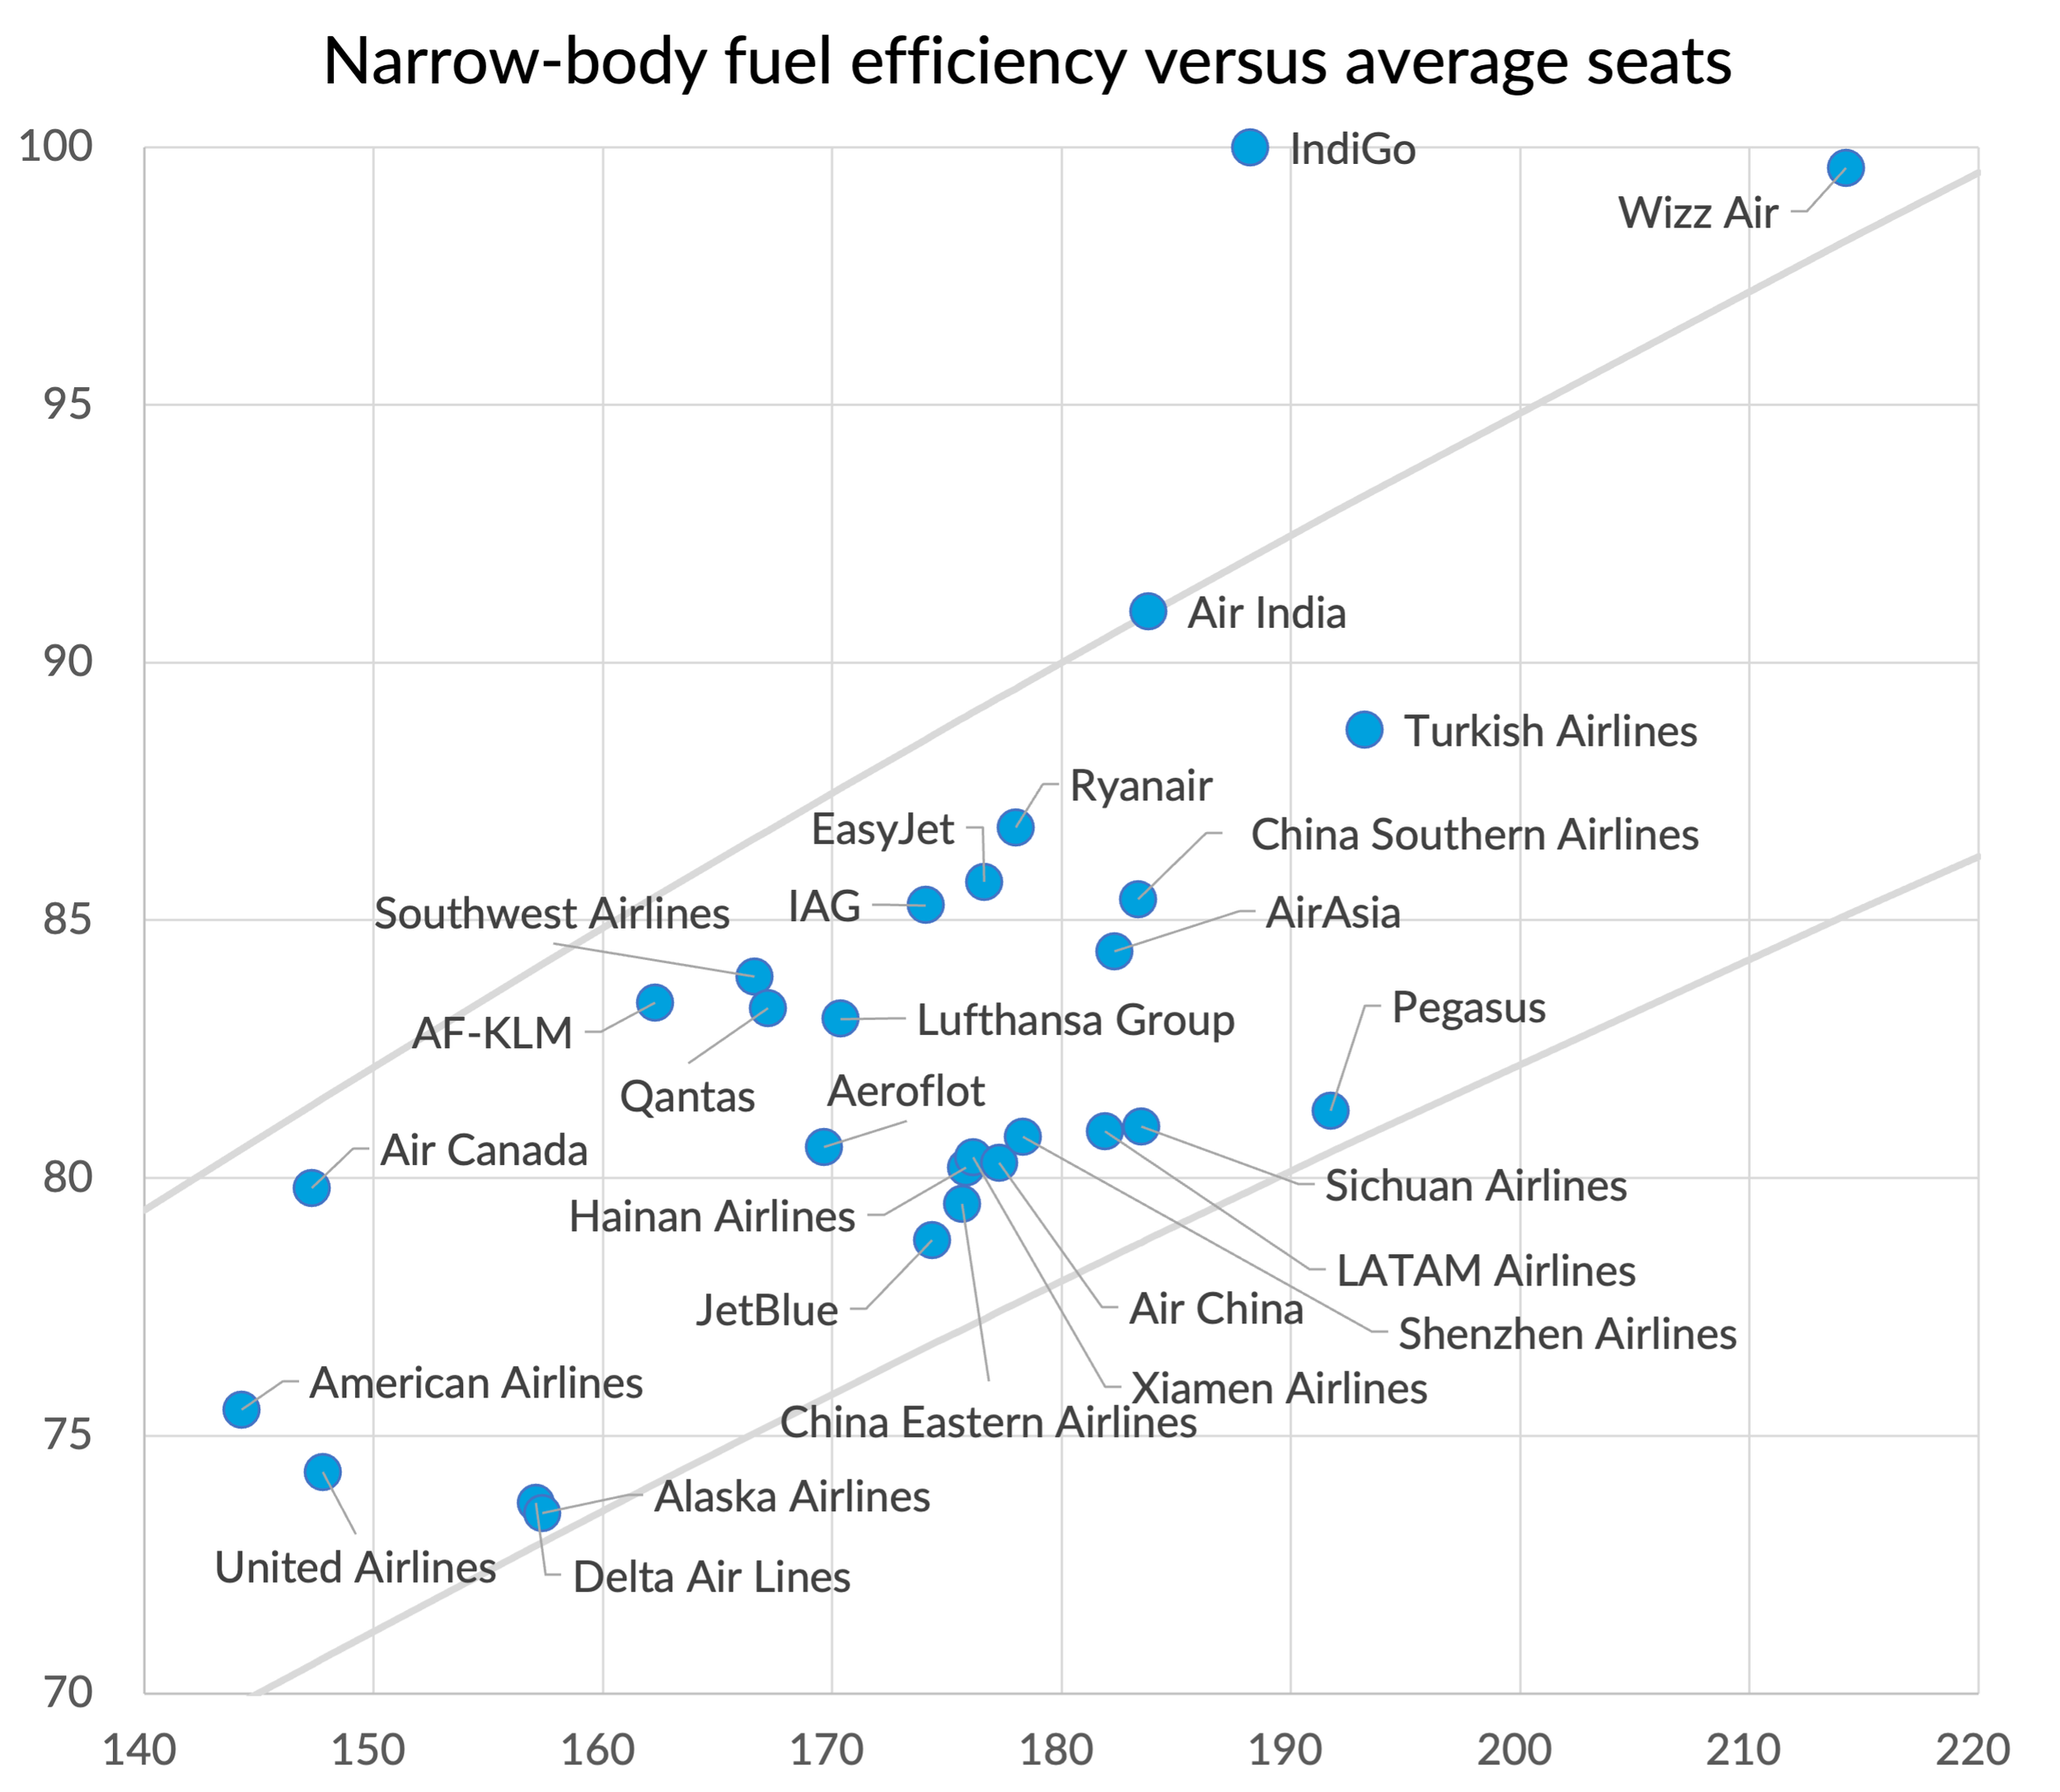
You can see that Wizz Air achieves its very high fuel efficiency score in part because of its abnormally high average aircraft size, with the A321 accounting for 89% of its block hours. IndiGo actually does slightly better on overall efficiency, despite having aircraft which are 12% smaller on average. Only 39% of IndiGo’s block hours are A321s and 10% are ATR72 turboprops. Turboprops are slow and unpopular with customers, but they are very fuel efficient. Also 93% of IndiGo’s A320 family operations are NEO variants, whereas only 78% of Wizz’s are.
We commented before that Wizz’s fleet has a 15% fuel efficiency advantage compared to Ryanair’s fleet. This drops to less than 5% when you account for the aircraft size effect. I also suspect that at the moment Wizz might be wishing they had more A320-NEOs in the mix instead of so many A321s.
At the other end of the fuel efficiency spectrum, the US airlines look a bit better than they did before, once you adjust for aircraft size. Nevertheless, they still generally score quite badly even allowing for this.
How do things look when it comes to the wide-bodies? Here is the data on the same kind of chart.
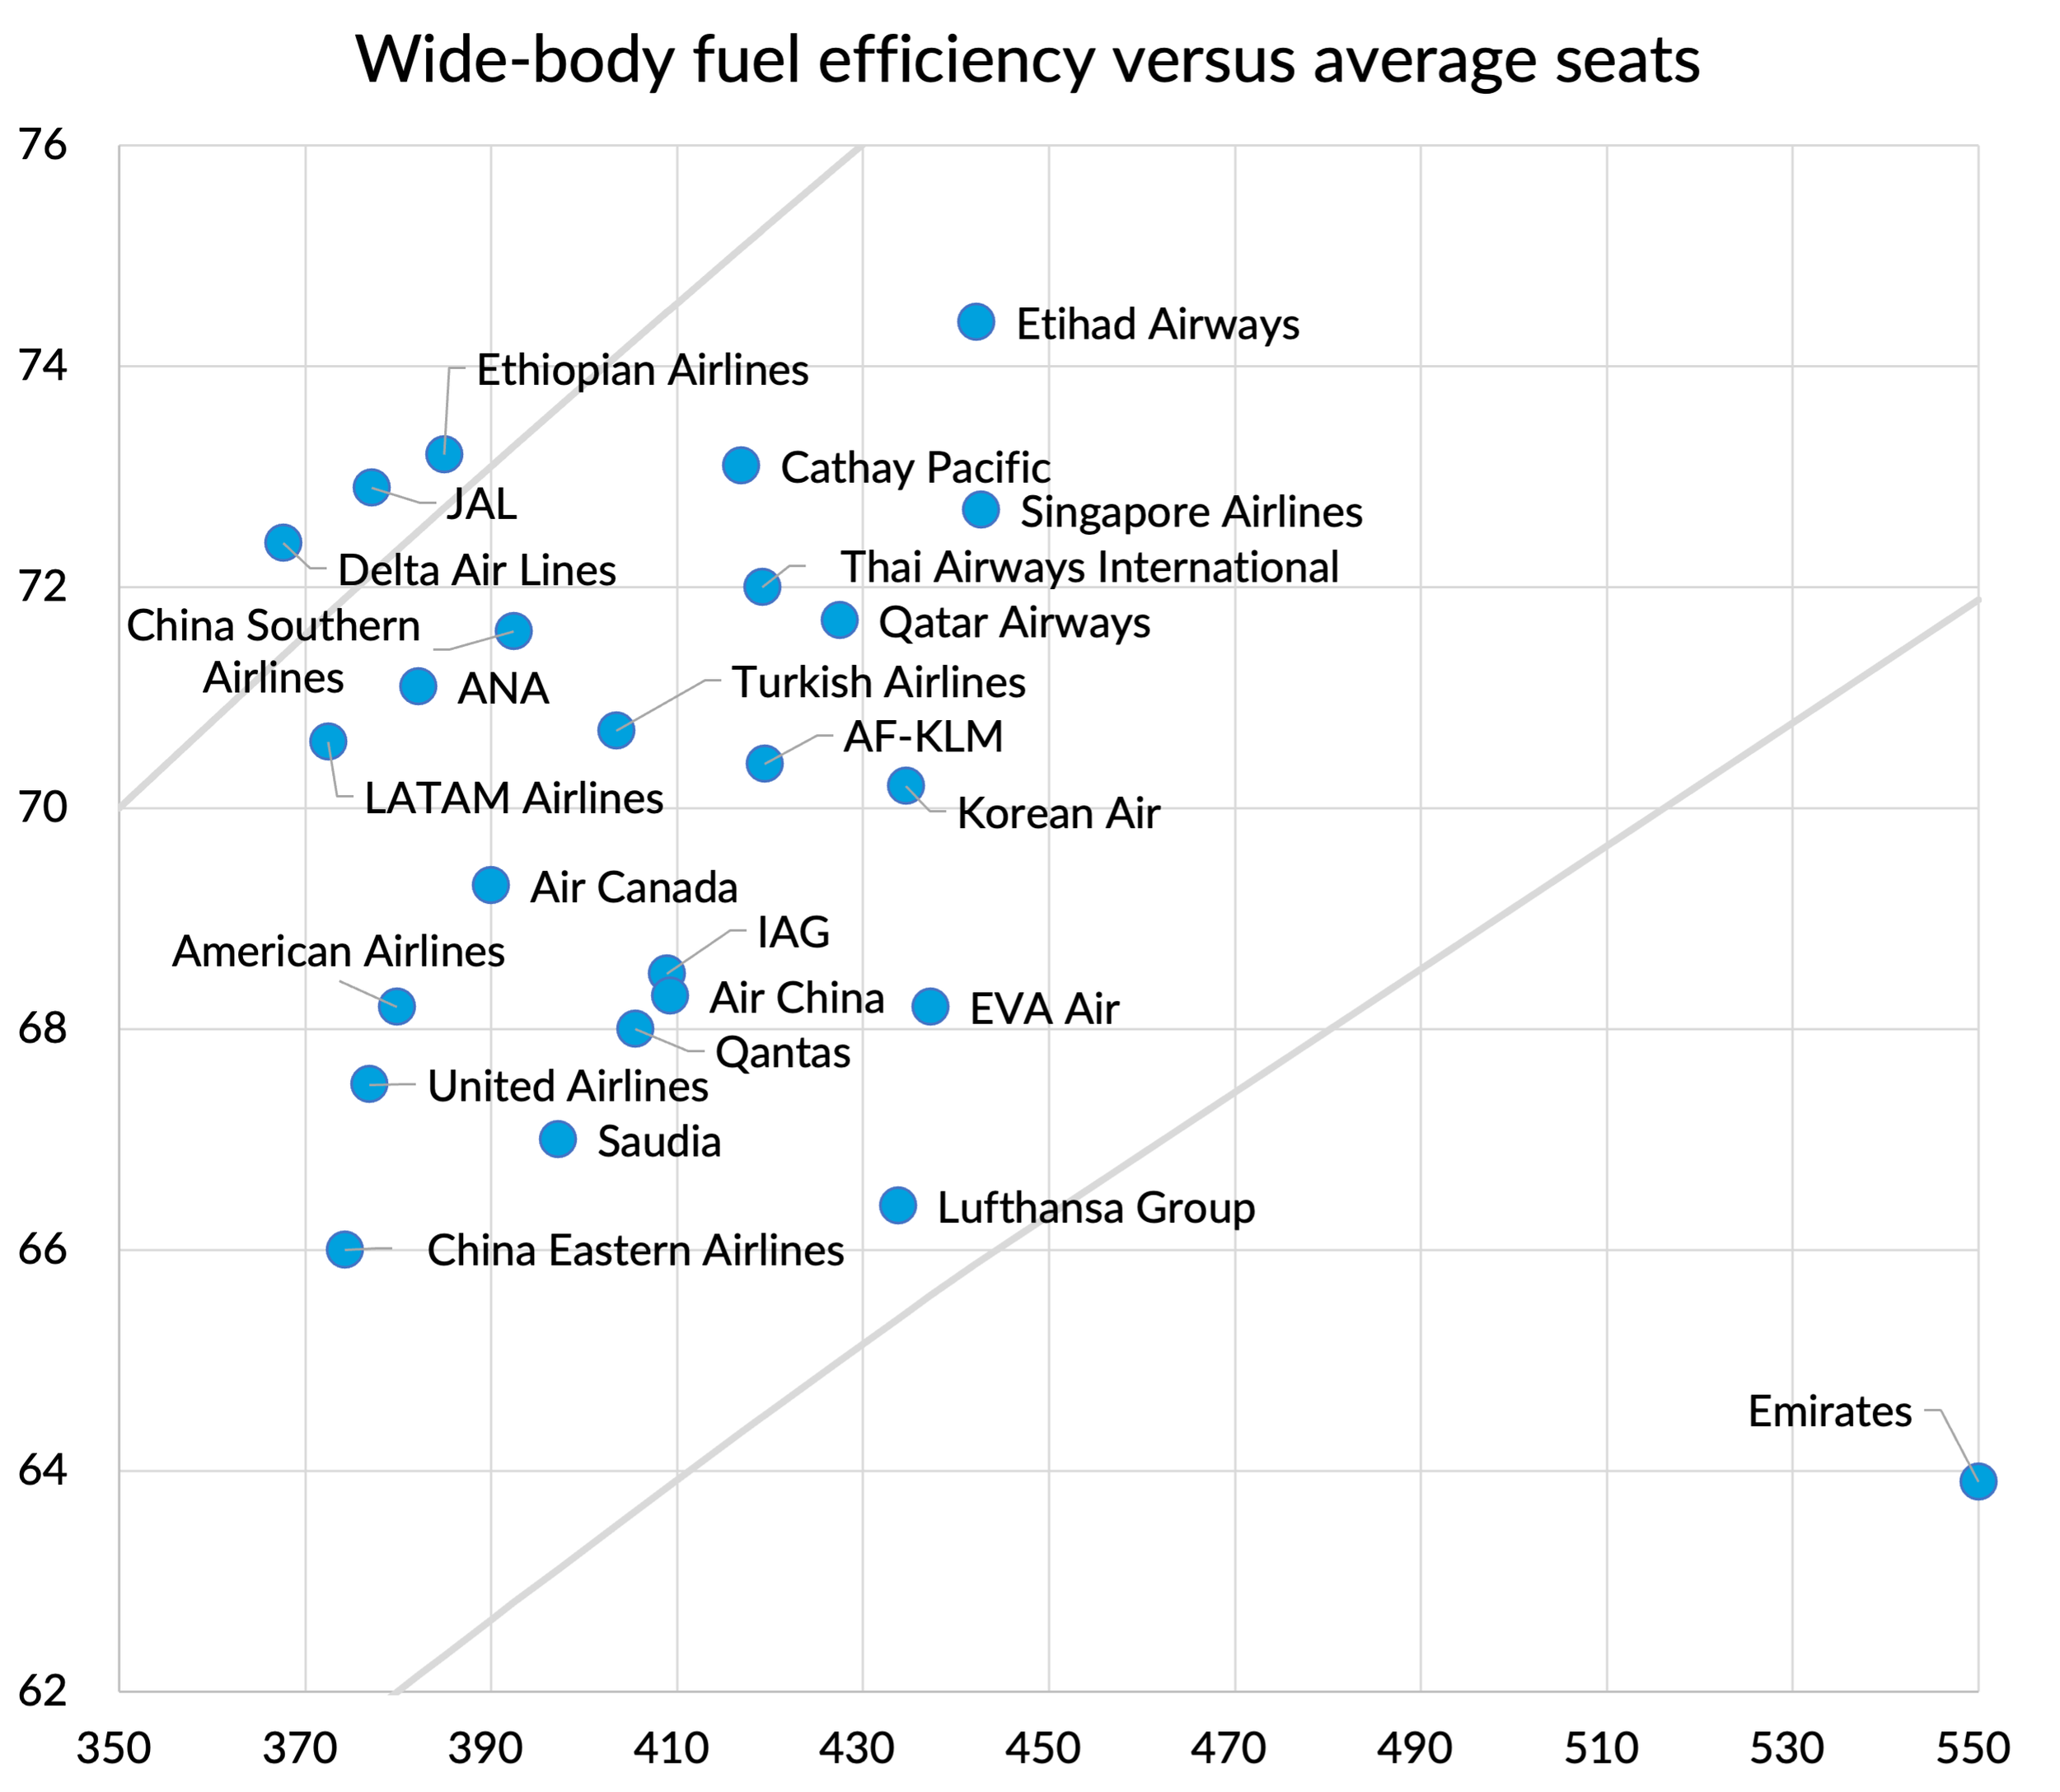
Emirates of course shows as even more of an outlier now. It is bottom of the pile for fuel efficiency despite having the biggest aircraft by some margin.
The weakness of Lufthansa Group’s position is also more apparent. Only 35% of its wide-body hours are on new generation fuel-efficient twins. 30% are flown by four-engined aircraft. As a result, the group is embarking on what it describes as the biggest fleet modernisation programme in its history. But being behind the curve, flying big, fuel-inefficient aircraft, is going to be painful in current market conditions. Their big hope is that the boost to traffic from the ongoing disruption to the operations of their Gulf competitors will more than compensate.
Delta’s performance looks even better than before. It has the lowest overall average aircraft size but still manages one of the highest fuel efficiency scores, thanks to almost half of its flying being on A350-900s and re-eingined A330-900s. It flies no four engined aircraft.
Our former leader, Etihad, doesn’t look quite so good on this basis. The performance is still strong, since 79% of its aircraft are “new generation”, but it uses a lot of the larger family variants to achieve its fuel efficiency score and its performance gets held back by its A380s.
Smaller airlines
In the above analysis I decided to look only at the largest global airlines. However, very often it is the small airlines that come out with the best fuel efficiency scores. Small airlines can do a complete fleet replacement much more quickly than a large airline can. They often have a stronger incentive to do so, as it is harder for a small airline to manage a lengthy transition with mixed fleet types. A fast transition isn’t really an option for the biggest airlines. Boeing and Airbus just don’t produce enough aircraft each year to turn over the entire fleet of a major US airline quickly.
In any event, I thought I’d show the top 20 highest fuel efficiency scores without restricting ourselves to the big guys. Here is the wide-body version, with European airlines making a good showing. Corsair, the low-cost French carrier, comes out top with a pure A330-900 fleet. Some might argue with my assumptions on this aircraft’s fuel efficiency compared to the A350-900. I have the A330-900 very slightly ahead, despite the A350 being a more modern design. However, the A350 is optimised for longer range which comes with a penalty. In reality, I think it depends a lot on the actual seat configuration airlines choose, with some suiting the narrower A330 cross-section and some working better with the A350’s wider fuselage. The A330-900 has not been without its problems when it comes to engines, which hasn’t helped its reputation.
The largest of the top 20 is Virgin Atlantic. They’ve transformed their fleet in recent years, with a fuel efficiency increase of 23% since 2019. 85% of their hours are now flown on new generation twins, compared to only 50% back in 2019. They come a long way from the days when they ran those “4 engines 4 long-haul” ads.
The following chart shows the narrow-body top 20. Indigo and Wizz still show up near the top of the rankings, but Oman-based SalamAir takes the top podium position with a fleet consisting of a mix of A321-NEOs and A320-NEOs.
The duration of the fuel price shock will be key
How strategically significant these fuel efficiency differences will turn out to be depends a lot on how long high fuel prices persist. It would take a brave airline strategist to make long-term fleet and network decisions today, with the situation in the Gulf and the oil markets changing on an almost hourly basis.
However, there is a lot to be said for making sure your fleet and business strategy is robust to higher fuel prices. The world’s energy markets seem likely to remain volatile, whatever the next few weeks and months bring in the Gulf. And in many ways the current fuel price spike might be a good rehearsal for the long-term trajectory of effective fuel prices as the industry transitions over to Sustainable Aviation Fuels and emissions charges spread throughout the world.