
Normalising Q2 results for fuel and emissions hedging
Comparing June quarter European airline results
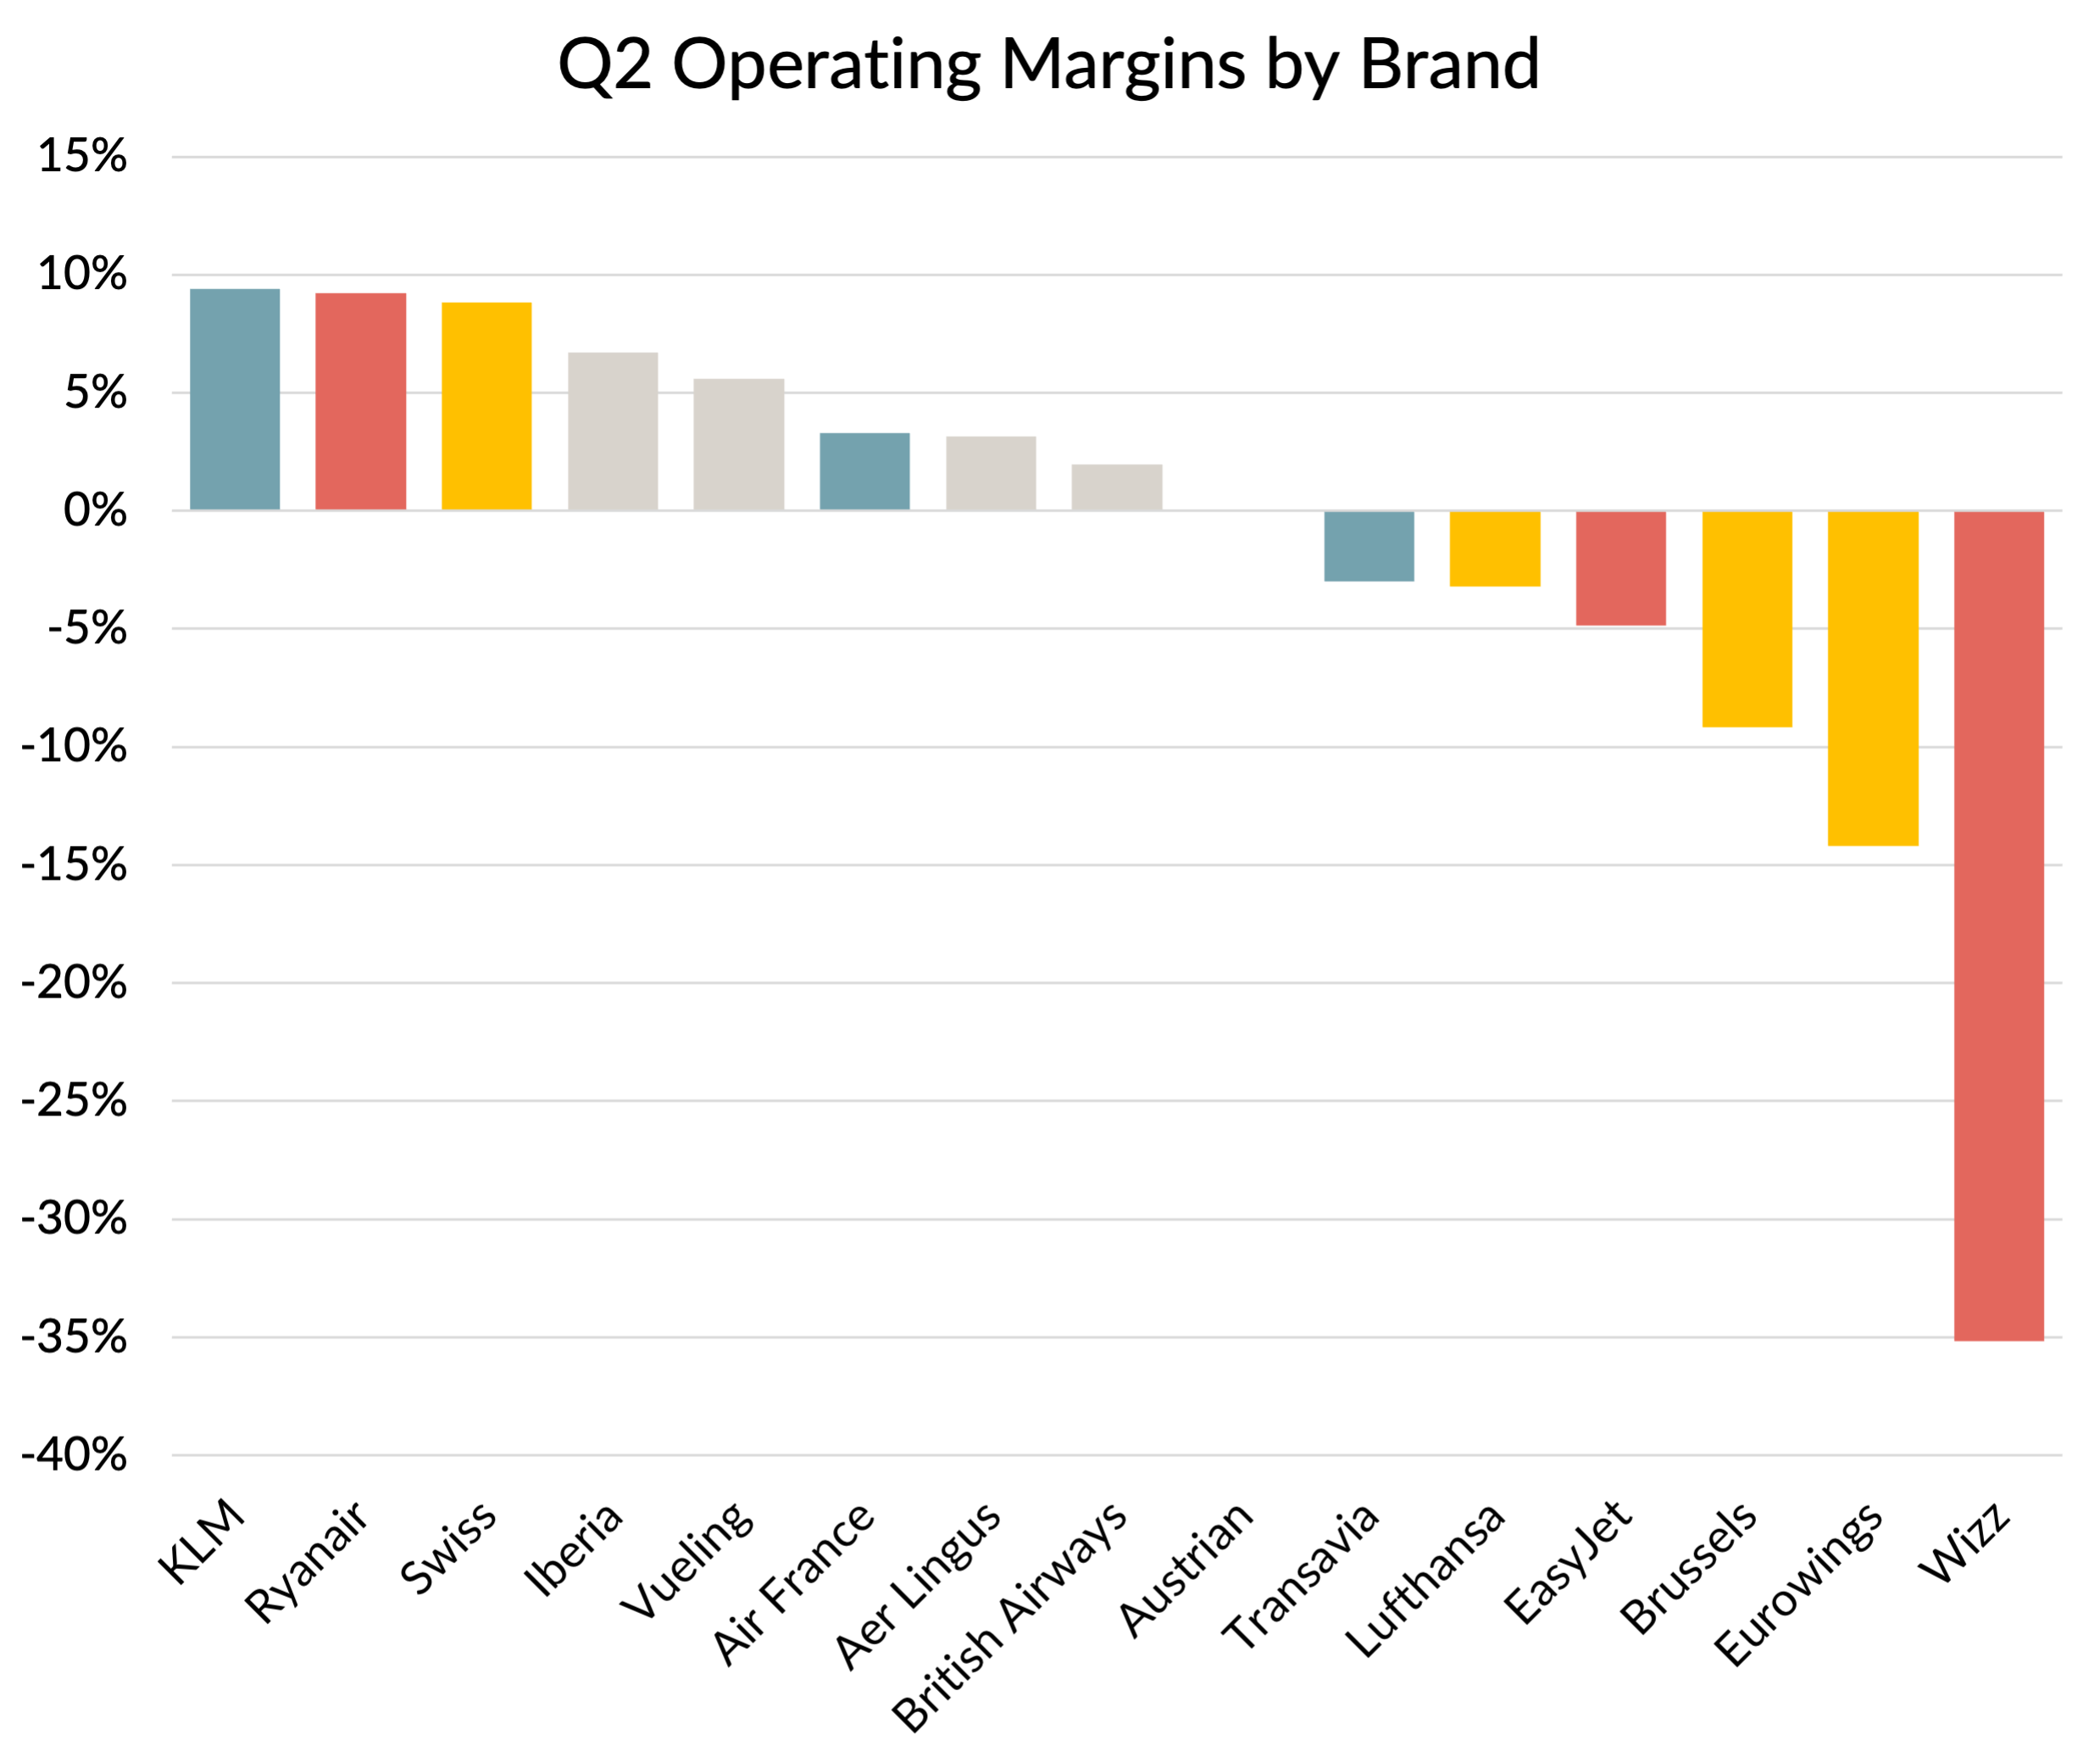
I’ve been looking into the results for European airlines and trying to decide which airlines are doing well, and which are not. I recently posted this chart showing the figures for the big three low cost carriers (in red) and the airlines in the big three network airline groups (blue for AF-KLM, gold for Lufthansa Group and grey for IAG).
Source: Company reports
However, a lot of the reason why some airlines did better than others was due to decisions on fuel hedging. Hedging profits and losses are real enough of course. They can make a massive difference to results. But I do think it is useful to try to separate out that effect and look at the “underlying” performance. Not least because hedging positions will unwind over time and looking at a normalised picture can give a pointer for future profitability.
TL;DR
I know that there are readers out there who are not interested in the details of airline economics and accounting. For your benefit, I’ll give you the TL;DR.
After normalising for hedging, Ryanair still looks the best of the big three European low-cost carriers and Wizz is still the worst, although the gap narrows a bit. But even Ryanair would not have made money in the June quarter at the currently prevailing costs for fuel and CO2 emissions. The estimates that I have developed suggest that the company would have made an operating loss without hedging at fuel prices of $1,100 per tonne (roughly the current price at which fuel can be bought forward) and current emissions costs. That tells me that yields will need to rise further, even if fuel prices follow market expectations.
For the airlines within the big three network groups, KLM, Swiss, Iberia and Vueling all look good, even after normalising for fuel hedging policies. In fact, all four airlines would beat Ryanair handily on that basis.
If you are still with me and are interested in digging into the detail, let us unpick the fuel and emission cost figures for the big independent low-cost carriers. I’m going to start with emissions, because they are bundled into the fuel expense line and it is hard to understand those figures without understanding what is going on with emissions charges.
The growing importance of emissions costs
With all the focus on fuel prices, I don’t think enough attention has been given to the growing importance of CO2 emissions costs for European airlines. The European Union “cap and trade” system for flights within the EU has been in operation since 2008, although for much of the early years it was a bit of a side-show. That was partly due to the fact that the price to buy emissions credits in the the Emissions Trading System (ETS) has been rather low, until recently.
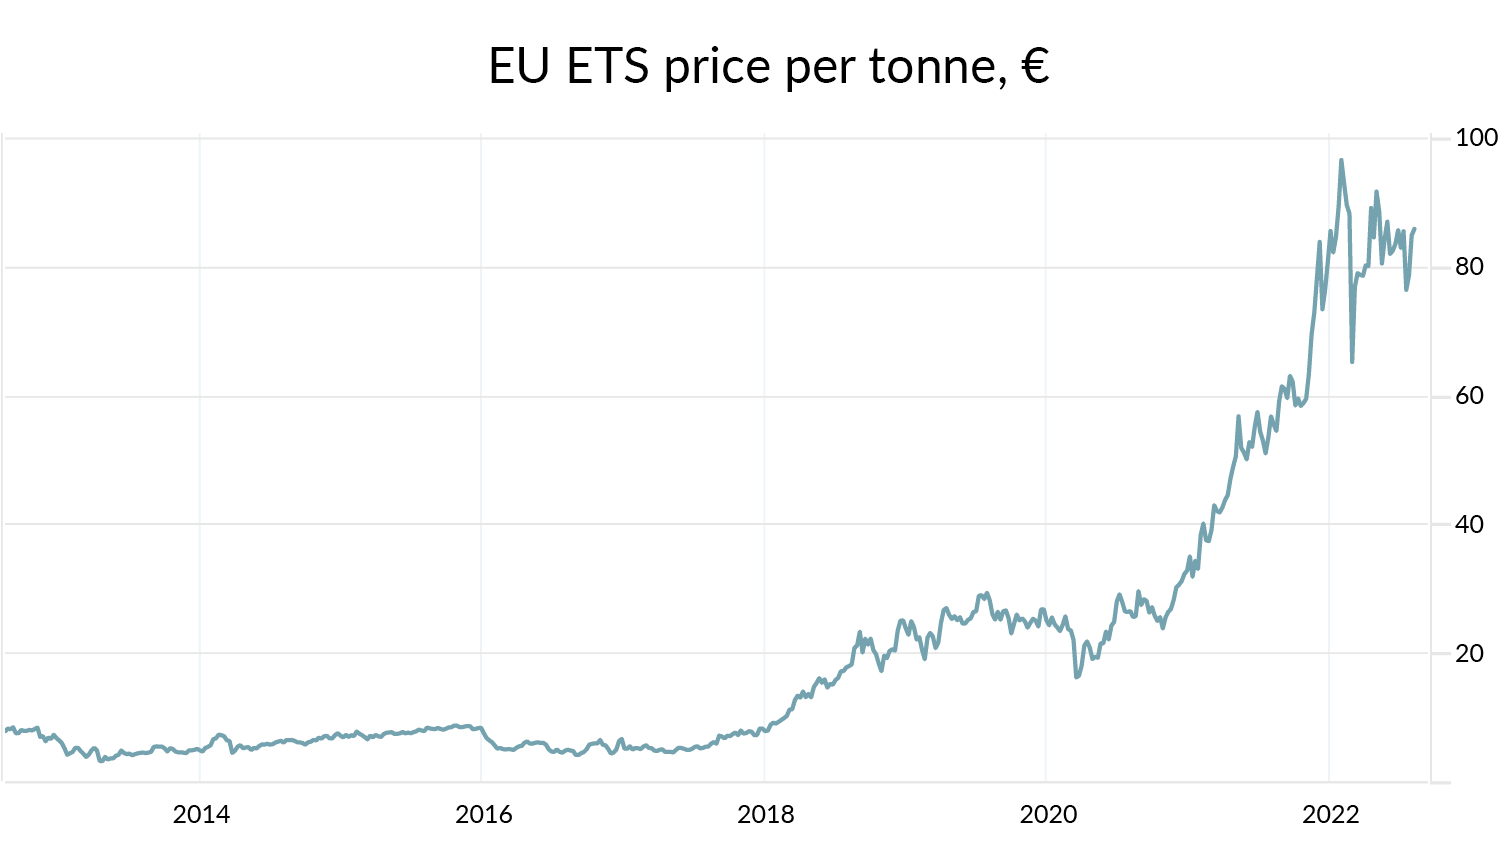
Source: tradingeconomics.com
The second reason why emissions costs weren’t that big in the past was that airlines were given free allowances based on a certain percentage of their historic emissions. That percentage wasn’t 100% though, and over the years growth has begun to add up. By 2019, growing airlines like Ryanair and easyJet were having to buy permits for the majority of their emissions. The proportion was higher for the faster growing Wizz. Even slower-growing BA was having to buy permits for almost half their emissions from European flights.

Source: European Commission, GridPoint analysis
From a cost to an income
The capacity shrinkages during COVID turned what had become a material cost into an income item for airlines. Airlines were not using their free allowances, which left them free to sell unused allowances for cash. Some may have kept their allowances for future use, but some will have taken the opportunity to boost their liquidity. It is not clear which airlines did that, but we know from the accounts of IAG’s Vueling that they sold allowances in 2020, realising €69m. Whilst that was an understandable move given the cash pressures at the time, those same allowances would have been worth €194m more at today’s prices.
Emissions costs today
Coming back to the June quarter of 2022, airlines were operating enough capacity to fully utilise their free allowances and had to buy additional permits. Both Wizz and Ryanair have grown quite a bit compared to 2019 too. At the same time, the free allowances have been reducing as the EU progressively tightens the screws on the industry.
As we saw before, the cost of buying emissions rights has risen massively since 2019. Brexit has exacerbated this for airlines flying from the UK. The UK government refused to allow its replacement scheme to be formally linked to the EU scheme, for political reasons. That hit market liquidity, which has led to even higher prices for airlines operating flights from the UK.
Brexit: the gift that keeps giving.

I’ve crunched the numbers on the likely emissions costs for the June quarter, assuming airlines were paying market rates. The following chart shows what those costs would represent as a proportion of revenue, and demonstrates how material these costs have now become.

Ryanair shows as the highest here, due to a combination of significant growth and the fact that 93% of its capacity is within the scope of the EU or the UK ETS. Wizz has even higher growth, but only 72% of its flying is within scope. easyJet has 88% of capacity in scope, but its lower growth means that a lot more of its emissions were covered by free allowances.
The costs I showed were based on airlines paying market rates for their emissions. That should be a good estimate for Wizz, as we know they didn’t hedge. I’ve not been able to find any information on easyJet’s CO2 hedging policies. The fact that they don’t mention it suggests that they didn’t hedge either. But we do know that Ryanair did much better. Going into the second quarter, they had hedged 85% of their liability at a price of €53 per tonne. That will have saved them something like €66m or 2.5% of revenue in the quarter.
Fuel hedging
We don’t have precise information for the actual prices these airlines paid during the quarter, net of hedging, but we can make some reasonable estimates.
In May, Ryanair said that they were 60% hedged at $62 per barrel, with a further 20% protected by caps at $71 for the six months ending September 2022. That will have been a bit front-loaded into the June quarter, so I’ve assumed 65% at $62, 25% at $71 and the remaining 10% at the spot rate. We need to convert these per barrel figures into $ per metric tonne, which you would normally do using a conversion factor of 7.89. But the slide in Ryanair’s investor presentation which gives the hedging data says that they have used a conversion factor of 10. I’ve no idea why - perhaps they are trying to show what the “crude oil equivalent” price is and fudging together the tonnes to barrels conversion factor with the crack spread? Anyway, the sums work out best in terms of predicting their fuel bill if I convert using their 10x factor. With a spot price of $1,300 per tonne and an into-plane premium of $120 per tonne, I end up with an average cost of €779 per tonne. We can estimate fuel volume figures because Ryanair reports its CO2 emissions per RPK on a monthly basis. Since we know their passenger numbers and the average stage length, that gives us CO2 volumes. We can convert those into fuel using the standard 3.15 conversion factor. Multiply out by the estimated fuel cost per tonne, and add in the emissions cost estimates we’ve already made and we have a figure for the total fuel cost expense for the quarter. It comes out 2.3% higher than the actual reported number. Very close, but suggesting that the real average fuel cost was a little lower at €760 per tonne.
When it comes to Wizz, we know they didn’t really hedge, so fuel prices should have been something like $1,300, plus an into-plane premium of $120, giving $1,420 per tonne. Once again, we can calculate fuel volumes from their CO2 figures to get a fuel cost, to which we can add our estimated emissions costs. The estimate this produces is about 5% above the reported fuel and emissions cost number. The average fuel price would need to be $1,340 for the figures to reconcile exactly, so I guess they did beat the spot rate slightly.
For easyJet, in their March quarter results, they said that 71% was hedged at $619 for the April to September period. Again, I’ve assumed this was front-loaded and so I’ve taken 80% at $619 and the rest at $1,300, giving an average of $755. Adding $120 for the into-plane premium, we get $875 per tonne. We don’t have a reported number against which to reconcile, so this is the least reliable estimate of all the three, but it is the best I can do.
To summarise, the following chart shows the estimates I get for average fuel cost per tonne, including the into-plane premium.

Source: GridPoint estimates and analysis
So what does all this tell us?
At this point, you might be asking why I have gone to all this trouble to disentangle the fuel and emissions cost line into its component parts: emissions versus fuel and volume versus price. The first thing it achieves is to allow me to normalise the figures for consistent fuel and emissions hedging policies. I’ve normalised to a fuel price of $1,100 per tonne (roughly the current futures price with an into-plane premium added) and average market prices for carbon for the Q2 period (€84 for EU ETS, €96 for UK ETS). I’ve also adjusted the figures for stage length differences (using A320 fuel burn versus distance data).
Anyway, here is the chart with the stage length adjusted figures, as reported and normalised for consistent fuel and emissions prices.

* Adjusted for stage length (to 1,200 km)
Source: Company reports, GridPoint estimates and analysis
The results are slightly surprising to be honest. We know that there are reasons driving emissions cost differences, but having corrected for stage length differences and after normalising the fuel prices, you would have expected to get very similar figures for fuel cost per ASK.
These figures imply that easyJet had 5% higher fuel burn per seat than Ryanair on the same sector length. The biggest driver of that will undoubtedly be that the company gets nine fewer seats on most of its A320s than Ryanair gets on its 737s, worth 5% in fuel burn per seat on those aircraft and the A320 probably also burns 1% more fuel than the 737. easyJet operates some less fuel efficient A319s, although they do have some A321 NEOs. Overall I calculate that their fleet is 5% less efficient per seat that Ryanair’s, which neatly accounts for the observed difference.
The problem is with the Wizz figures, which are harder to explain. The fuel burn per seat is a whopping 14% lower than at Ryanair. Yes, they have younger aircraft, deploy larger gauge A321s and are further along in switching to new generation aircraft. But they still fly plenty of A320-CEOs, which have the same seat count disadvantage as we saw at easyJet. Overall, I would assess their fleet as 4% more efficient in terms of fuel burn per seat, but the difference seems to be much bigger than that. They did operate with lower load factors than the other two - 7.3 points below Ryanair, which will have reduced fuel burn per seat, but I’m still at something of a loss to explain the size of the overall difference.
Normalised margins
The other thing we can now do is to show how the results would have compared with identical fuel and emissions hedging policies. I’ve normalised to the same $1,100 per tonne fuel price and ETS prices as I did before. Here is what the fuel and emissions costs would have looked like for Q2 as a percentage of revenue.

Source: Company reports, GridPoint estimates and analysis
If those had been the fuel and emissions costs, this is what the operating margins would have been.
Source: Company reports, GridPoint estimates and analysis
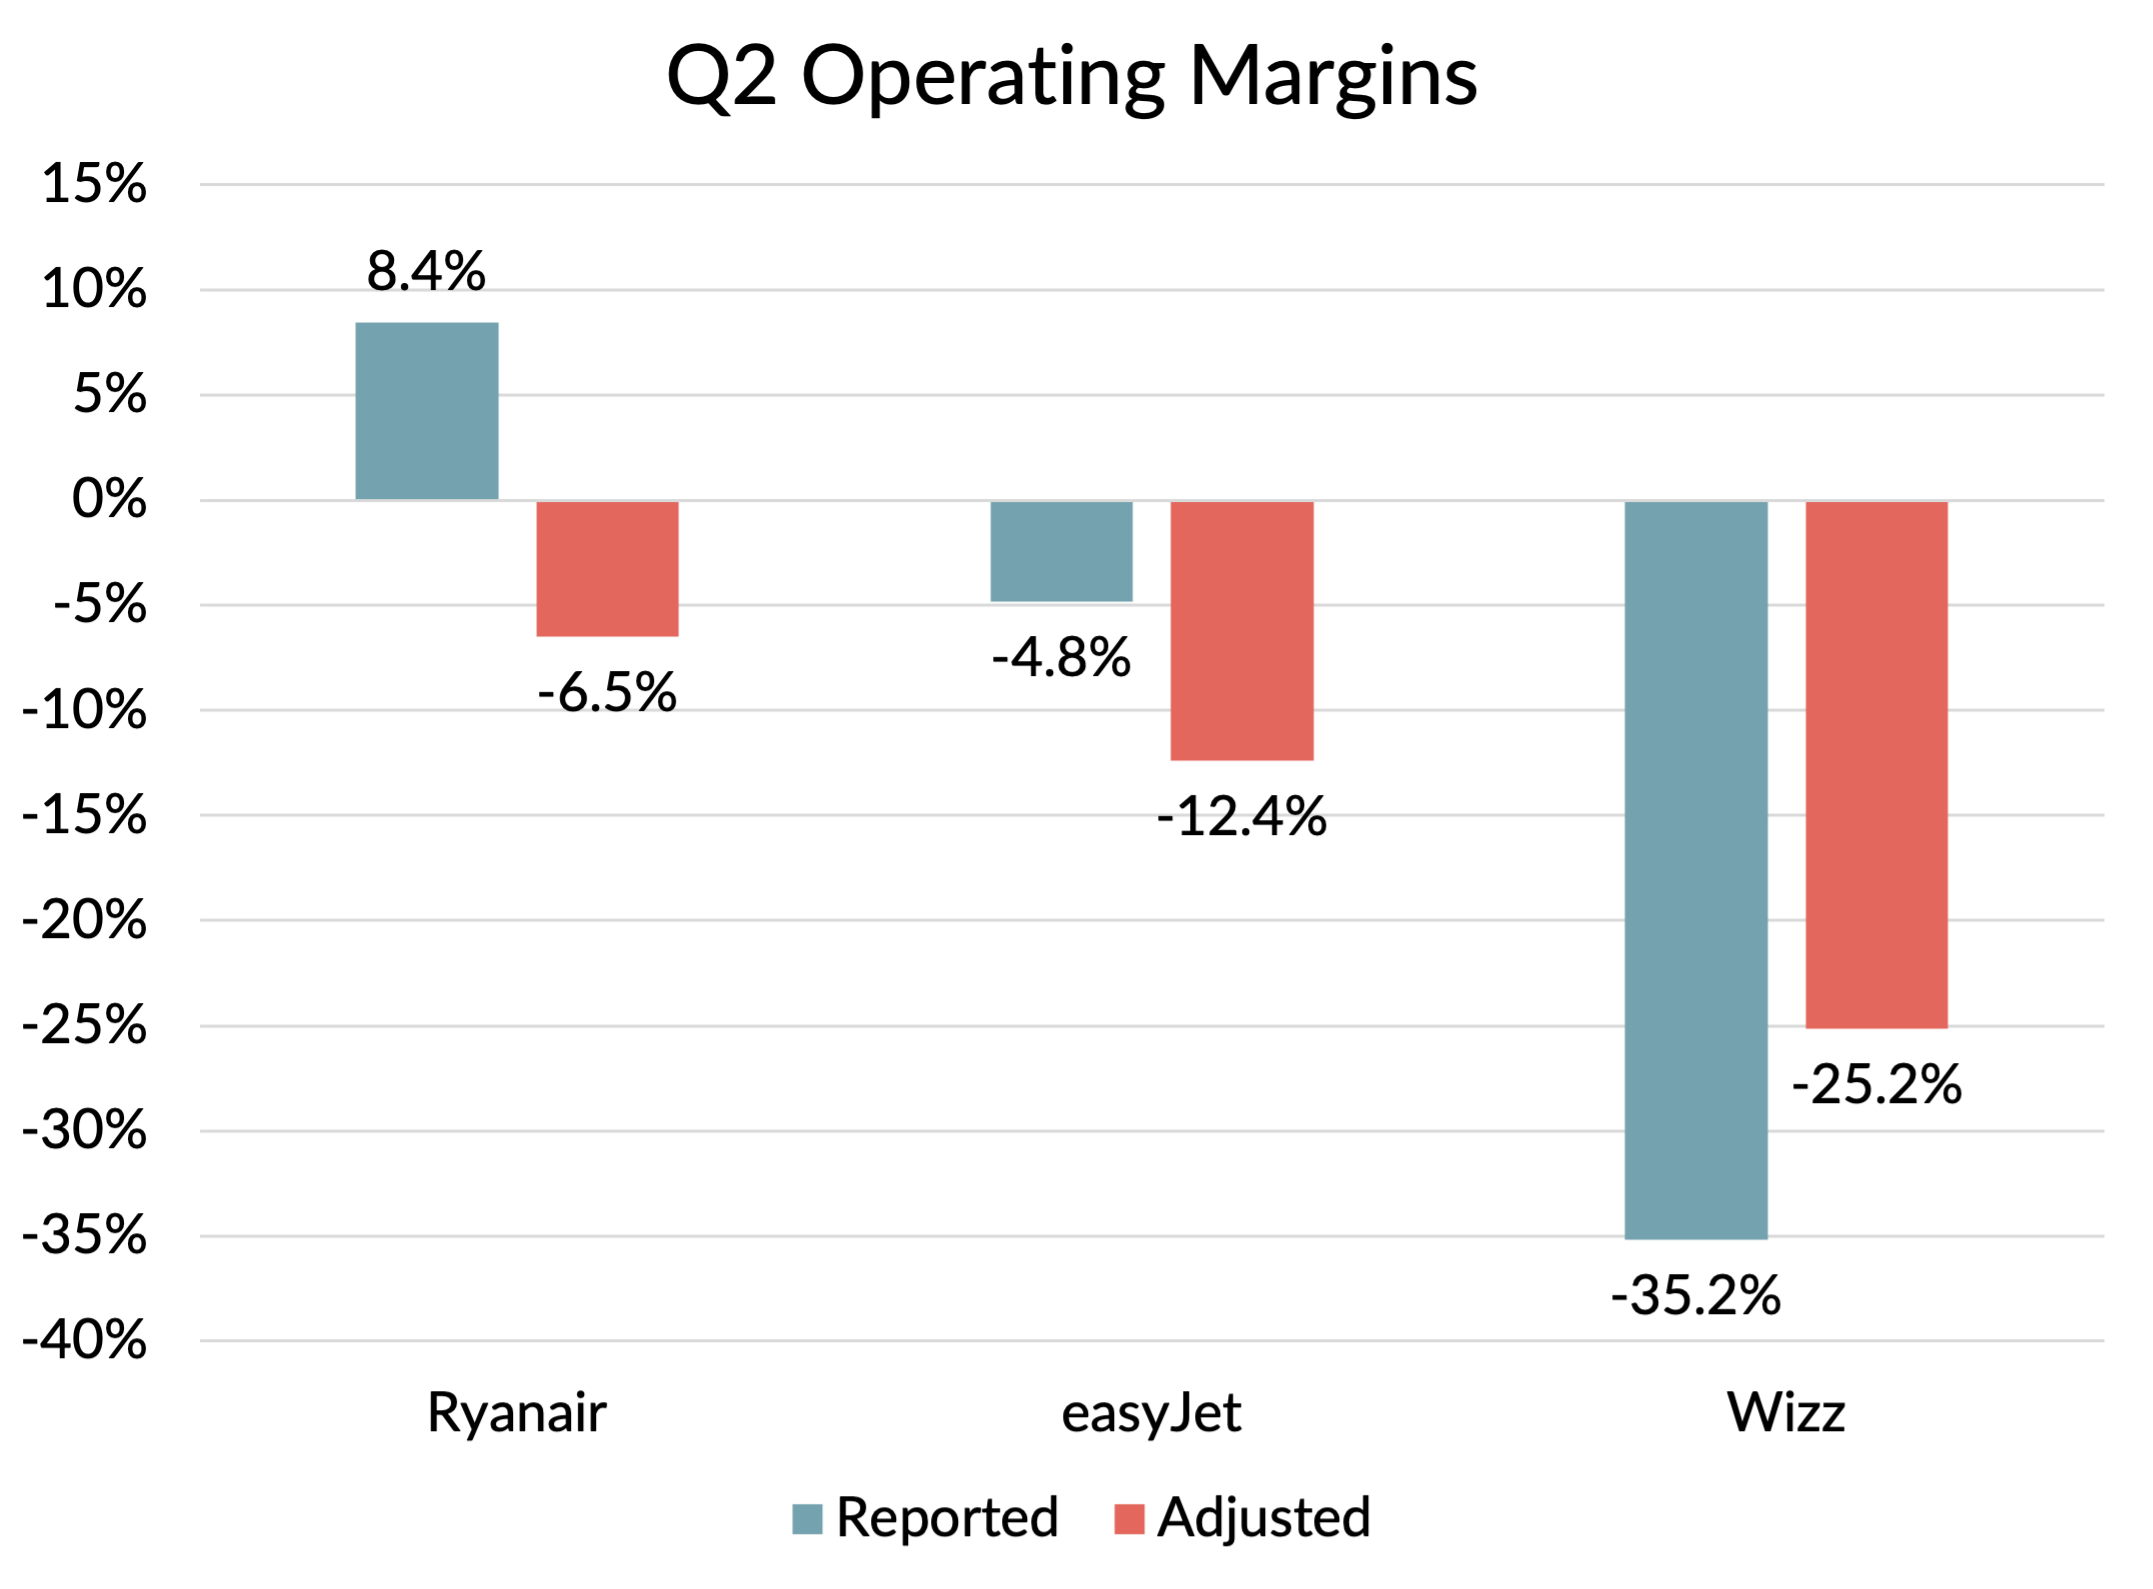
You can see that even after making these adjustments, the ordering of the three carriers doesn’t change. Ryanair still performed the best and Wizz was still the worst. The gap narrows of course, but I think this analysis shows that Wizz’s disastrous decision not to hedge is far from the only source of their problems.
Prices still need to rise a lot
This analysis also shows how much work even Ryanair still has to do to to get back to decent levels of profitability, once its hedging unwinds. Michael O’Leary was out again today talking about the “end of €10 flights”, and saying that his average prices would have to rise by 25%. With fuel and emissions charges now making up such a huge percentage of his costs, it is not hard to see why he has become such a convert to the need for higher prices.
So who did best in Q2, normalised for fuel hedging?
I haven’t done the same depth of analysis on the results of the airlines within IAG, AF-KLM and the Lufthansa Group.
In their Q1 results, IAG talked about a $1,350 per tonne spot rate translating into $905 per tonne rates for Q2, net of hedging and before the into-plane premium. So that would imply fuel costs of about $1,025 per tonne adding in the into-plane premium. That’s a bit below my $1,100 “normalised level”, but not a lot. Looking at the individual fuel cost figures by airline makes me think the price paid was not uniform across the group either. I suspect that Vueling was pretty close to the $1,100 per tonne benchmark. If that is true, its 5.6% operating margin looks quite impressive in the circumstances and would put it over 10 points ahead of Ryanair, normalised for hedging, and the best of the low-cost airlines in Europe on that basis. Iberia’s 6.7% also looks very good.
Air France - KLM said they averaged fuel prices of $1,076 in Q2 after hedging and including the into-plane premium . That’s very close to my normalised level. So as well as being the best operating margin on a reported basis, KLM’s 9.4% margin looks even more impressive compared to the others when normalised for fuel hedging policies.
Lufthansa Group said the breakeven crude oil price for their hedging in Q2 was $74/barrel and that they were 65% hedged. Translating that into a fuel price if the rest was at spot prices would suggest an average just over $1,000 per tonne. Allowing for the into-plane premium, that means that the Lufthansa Group results would improve slightly if adjusted to $1,100. So Swiss with an 8.8% reported margin also looks like a contender for best result on a normalised basis.