
Assessing Q3 performance from the European LCCs

Ryanair tops the charts in Q3
Yesterday’s strong September quarter results from Ryanair easily topped the European low cost carrier performance charts for what is usually the quarter of the year where they make all their money. It delivered profits of €1.4 billion in the quarter, both before and after financing costs. It has such a strong balance sheet that its finance costs are a rounding error.
The big three network carrier groups IAG, Lufthansa Group and AF-KLM reported Q3 pre-tax profits of €1.2 billion, €1.1 billion and €1.0 billion respectively. But much of that was earned on their sizeable long-haul operations. When it comes to making money out of short-haul operations in Europe, the combination of Ryanair’s size and profitability mean that it isn’t even a contest when it comes to the absolute size of the profits. The next nearest contender is easyJet, which indicated pre-tax profits for the quarter of between £525m and £545m.
In this article, I’m going to focus on the low-cost short-haul market in Europe and try and compare the performance of the main carriers. I’ve included seven carriers in this review. The three big independent low-cost carriers, Ryanair, easyJet and Wizz, and the low cost airline brands of the big three groups, IAG’s Vueling, Lufthansa Group’s Eurowings and AF-KLM’s Transavia. I also included Norwegian. Whilst only about half the size of Wizz, it is a similar size to Eurowings and Transavia. There are two other similarly-sized carriers I could have included, which are UK based Jet2 and Turkey’s Pegasus. I included them in my analysis later in this article on competitive overlaps, but as we’ll see Pegasus doesn’t really overlap much at all, so isn’t a very relevant competitor to these Western European players. I would have liked to include Jet2, but I left it out because we won’t get its results for another two weeks.
Without further ado, let’s get going on the comparisons.
Low-cost carrier performance
We don’t yet have the full results for easyJet - all we have is a “trading update” which gives a fairly narrow guidance for revenue and pre-tax profit. But I’ve had to estimate their operating profit and the margin figure might therefore be a percentage point or two out in either direction and for the same reason the operating cost figures for easyJet include an element of estimation.
Ryanair’s operating margin of 35.3% was 9.9 points better than the second best-performing carrier, Vueling and over five times better than the worst performer, Eurowings. The fact that Ryanair came out top is not a surprise, in particular thanks to having hedged its fuel costs at lower levels than the others. Conversely, we knew that Wizz would suffer badly from its decision not to hedge. However, I do think it is notable that Ryanair’s closest rival was one of the low-cost subsidiaries of the network airline groups.

Source: Company reports, GridPoint analysis. easyJet figure is estimated based on company PBT guidance.
The worst performer here was Eurowings. The margin based on the reported number for EBIT was 14.6%, but in order to show the performance of Eurowings itself, I’ve excluded the equity profit share they make from their investment in associate SunExpress, a joint venture with Turkish Airlines.
Stage length adjustments
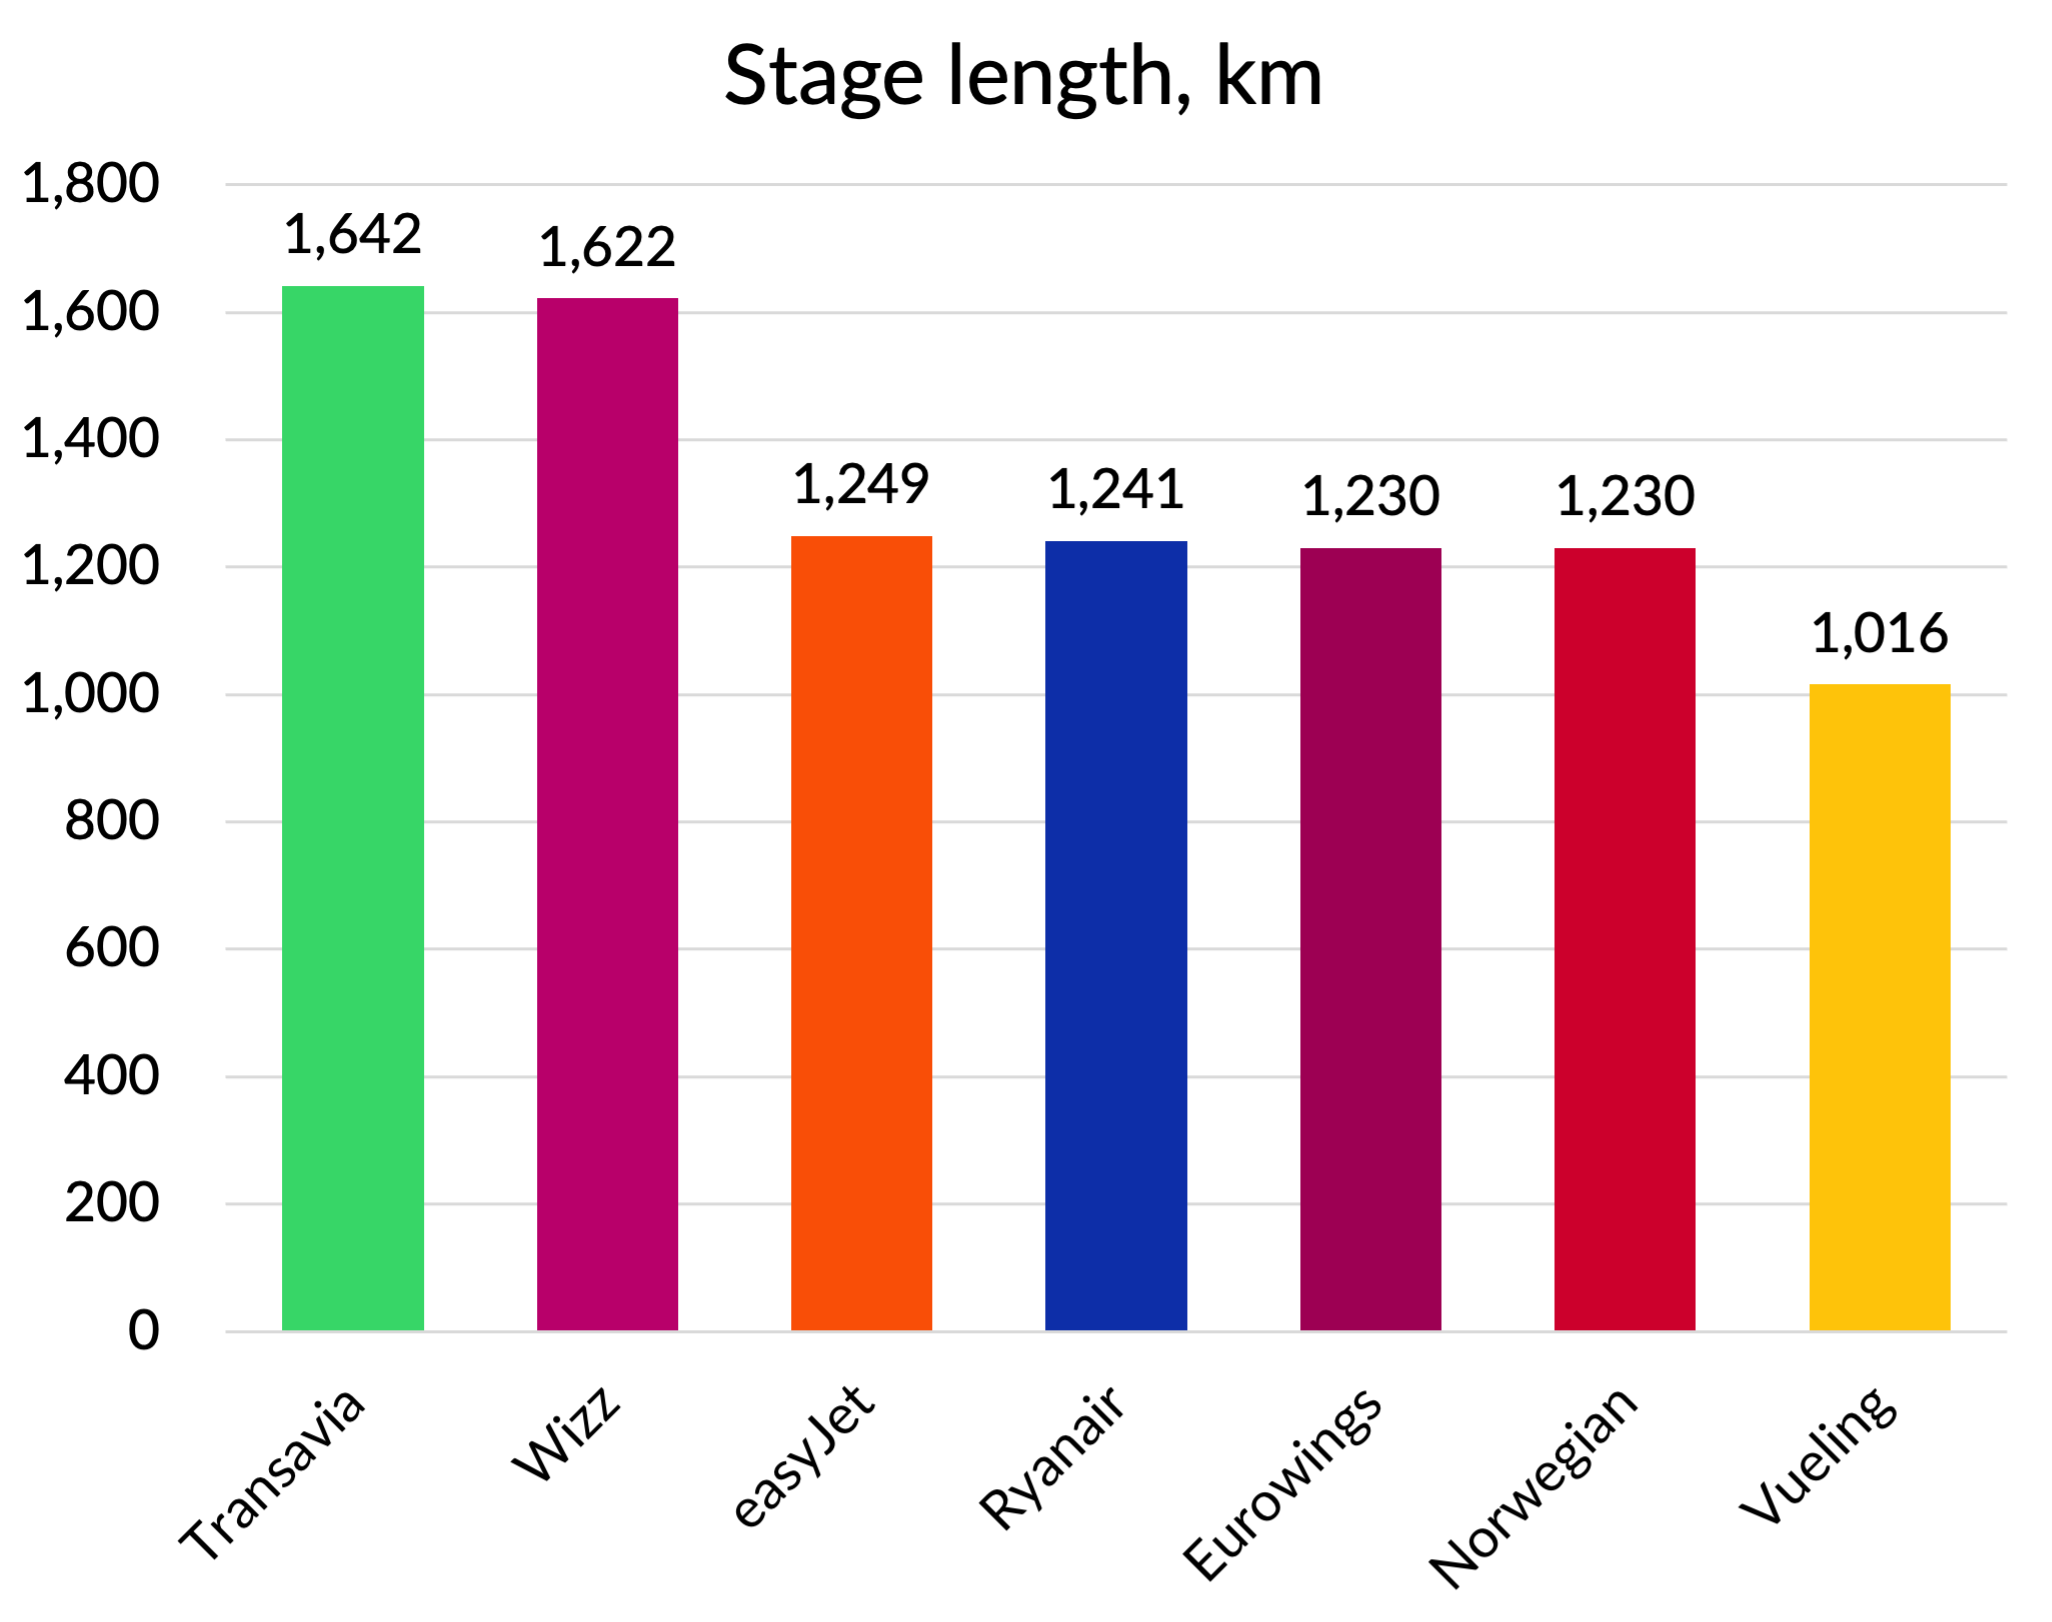
Most of the rest of the numbers in this analysis are going to be presented on a stage length adjusted basis. “Per seat” or “per passenger” metrics increase with distance flown. “Per ASK” or “per RPK” metrics go down. I've used the “square root of the stage length” basis to adjust all these figures to get to more comparable statistics, using Ryanair’s stage length as the reference.
For this group of carriers, Transavia and Wizz have unusually long stage lengths, whilst Vueling’s is unusually short, driven by a lot of domestic Spanish flying. Here are the figures for the third quarter.
Source: Company reports, GridPoint analysis and estimates
Unit costs
This being a review of the low-cost sector, I’ll start with unit costs. Before the pandemic, Wizz and Ryanair shared top ranking for the lowest unit costs on a full year, stage length adjusted basis. But that has changed. Ryanair’s unit costs excluding fuel in Q3 were virtually unchanged from what they were in 2019, whilst those of Wizz had gone up by 18%. Including fuel costs, the difference was even more stark, due to big differences in fuel hedging.
You can see that Wizz still occupies second place in terms of unit costs, but at this stage of the recovery, Ryanair has pulled out something of a lead.

Source: Company reports, GridPoint analysis and estimates
I’ll come back to a more detailed look at costs later, but there were important differences in commercial performance that I want to cover before I do that.
Commercial performance
Overall revenue performance can be judged by comparing Revenue per ASK (RASK). That picks up all three of the big performance drivers of load factor, average ticket prices and ancillary revenue generation. Again it needs to be stage length adjusted to get a fair comparison. I’ve shown the results below.

Source: Company reports, GridPoint analysis and estimates.
The best performer here was easyJet, benefiting in part from its greater focus on higher yielding main airports, although they do come with higher costs. The two “ultra low cost” or “ULCC” airlines Ryanair and Wizz, with their greater focus on secondary airports, generate the lowest unit revenues.
RASK is a combination of load factor and average yield. Most of the difference in RASK was driven by yield differences, but some was down to load factor. Ryanair performed best, with Vueling coming closest to matching them and easyJet not too far behind. Whilst WIzz’s 90.7% load factor was “middle of the pack”, this was a relatively poor performance, given its ULCC business model.

Source: Company reports, GridPoint analysis and estimates
Unfortunately, we don’t get any split of revenue between ticket and ancillaries for Vueling, Transavia and Eurowings. So I can only drill down on the split of the yield performance for the four independent carriers. IAG did say that ancillary revenue per passenger at Vueling was up 68% on 2019 levels, so it seems the performance there was very strong, beating easyJet’s 52% improvement compared to 2019.
Anyway, here are the figures that we have for ancillary revenue per passenger and you can see that this is an area where Wizz excels and Ryanair’s performance is relatively weak.

Source: Company reports, GridPoint analysis and estimates
The last commercial metric I’m going to show is the ticket revenue per passenger. That’s the part of passenger revenue that isn’t classified as ancillary. This is where easyJet, with its higher focus on main airports strongly outperforms the ULCC pair. But it was still beaten in the third quarter by Norwegian, probably in large part thanks to that carrier’s focus on higher yielding Scandinavian markets. For all that Wizz outperformed on ancillary revenue, it delivered the worst overall RASK performance thanks to weaker load factors and rock bottom unit ticket revenues.
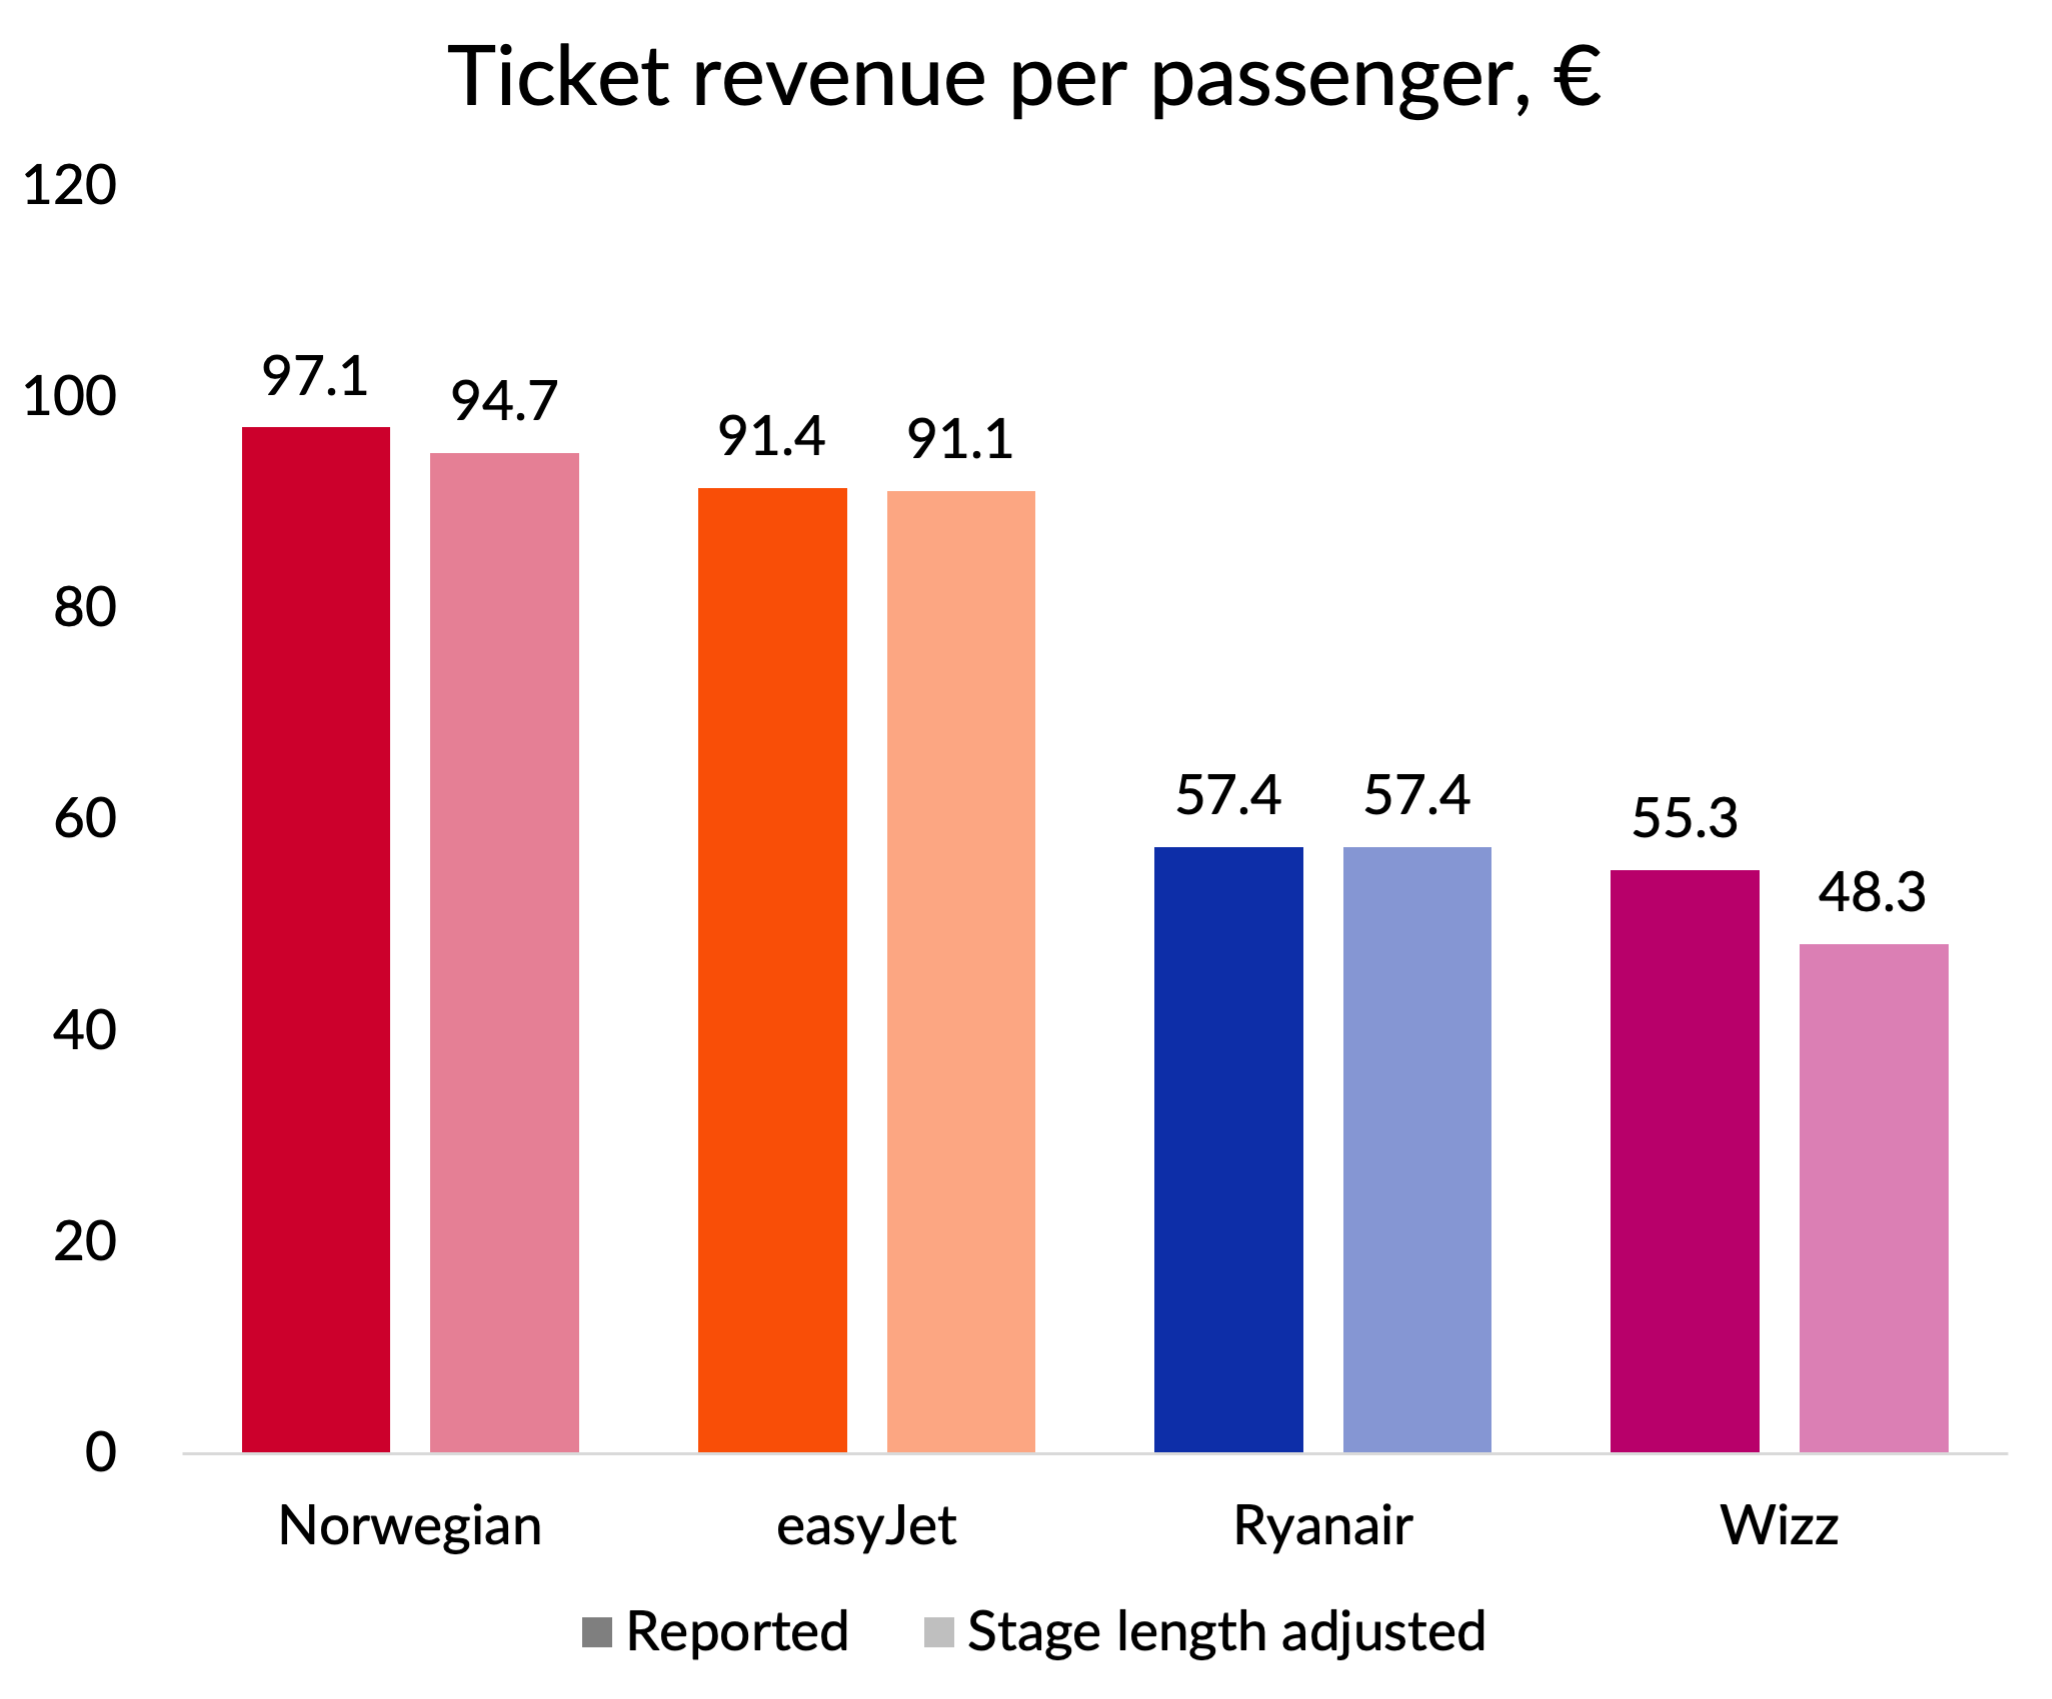
Source: Company reports, GridPoint analysis and estimates
I said I would come back to operating costs, so let’s do that now.
Operating cost performance
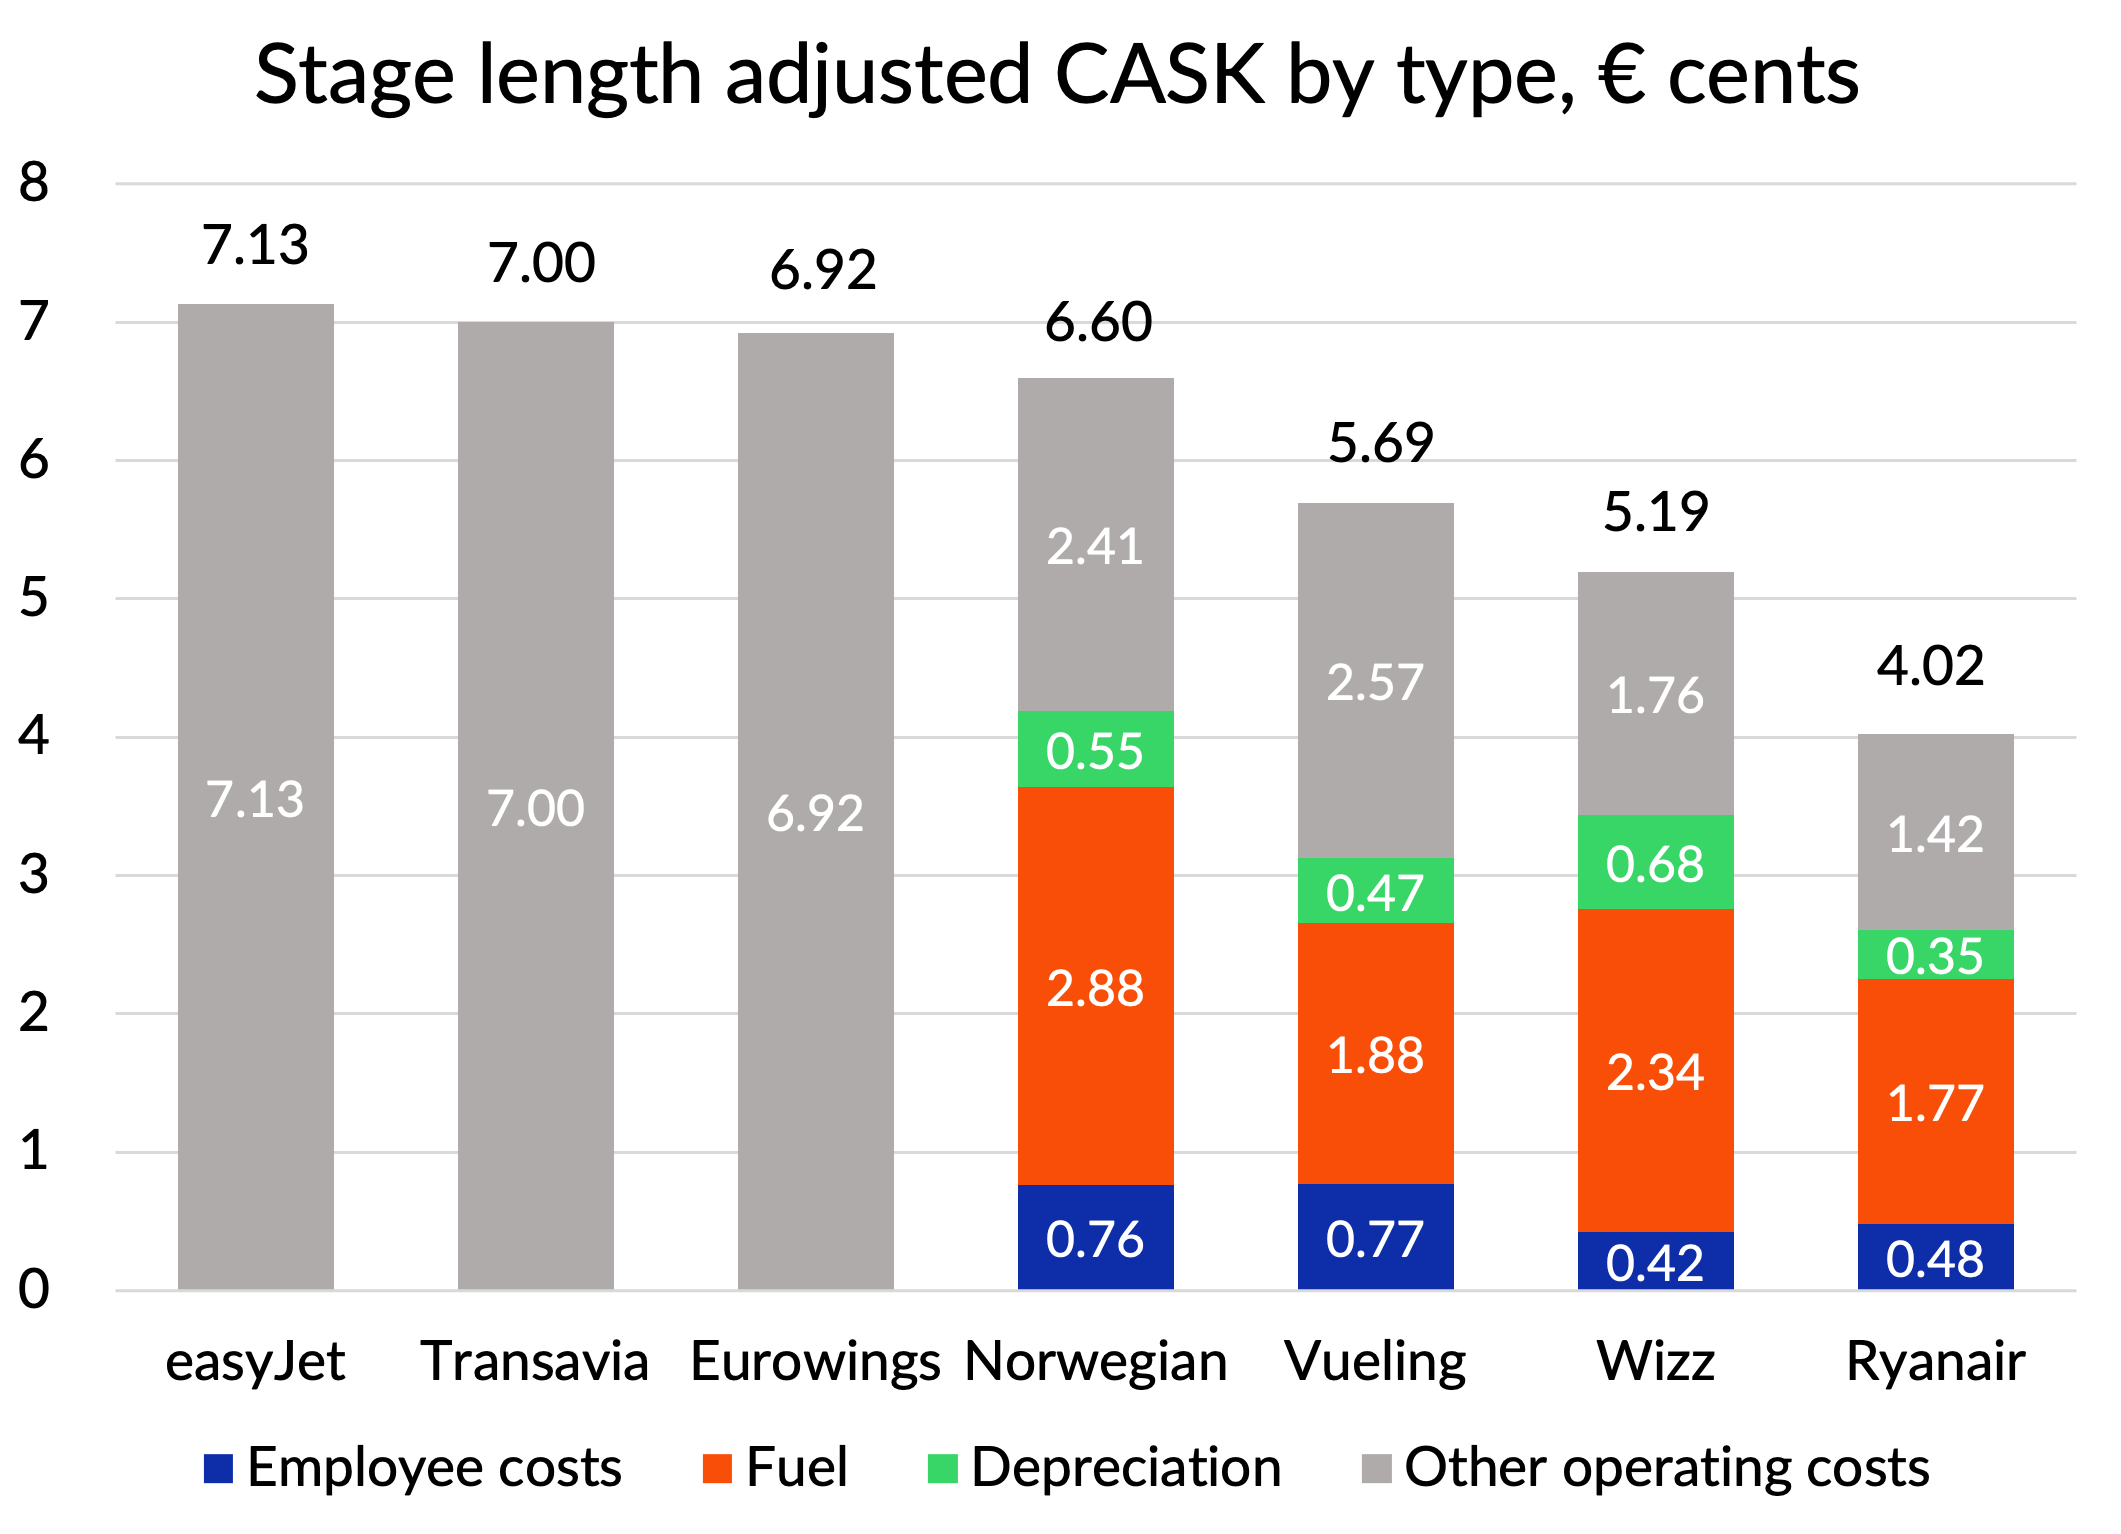
In the next chart, I’ve shown again the stage length adjusted cost performance, but I’ve included the split into the major cost categories, where we have it.
Source: Company reports, GridPoint analysis and estimates
We already saw how badly the CASK performance of Wizz was affected by its decision not to hedge fuel costs. But you can also see the impact that having the youngest fleet in Europe has on its depreciation costs.
Norwegian was also badly hit by fuel costs. Like Wizz, it failed to hedge its fuel prices and that was compounded by having a less fuel-efficient fleet, Only two of its 66 aircraft are more fuel efficient “new generation” aircraft, compared to 40% of Wizz’s fleet. Vueling’s unit fuel costs were quite close to Ryanair’s, despite being less advantageously hedged. 20% of Vueling’s fleet is made up of new generation aircraft, a greater proportion than Ryanair’s 14%.
Vueling has a significant disadvantage to both Wizz and Ryanair when it comes to employee costs. The 0.77 euro cents per ASK would have been 0.72 without the impact of back pay relating to prior quarters. But being 50% higher than Ryanair and close to Norwegian, which has the burden of Scandinavian labour costs to deal with, is not a great position to be in. Even worse, it is currently enduring a strike by its employees, who are looking for big pay rises.
Of course, pay rates are going up at Ryanair. As part of its Q3 results announcement, the company revealed that it was going to restore all the COVID pay cuts by the start of December. That will increase its costs going forward, but I think the scale of those pay restorations is in the 5-10% range, so that is not going to do much to reduce the size of Vueling’s employee cost gap.
We currently don’t have the breakdown of easyJet’s cost figures, as they didn’t give that detail in their trading update. We should get it when they publish their year end accounts at the end of the month. We do know that employee costs was one area contributing to their high unit costs in the past. It will be interesting to see whether they have made any progress in reducing the gap.
Whilst the Wizz unit labour costs look good, I do think the company suffered from crew productivity issues in the quarter. I’ve done some calculations on crew utilisation rates and I think they were about 10% worse than Ryanair. The company acknowledged that things were not fully optimised, so fixing this should go some way to closing the gap to Ryanair going forward. The same comment applies to aircraft utilisation. Let’s look at that next.
Aircraft utilisation
Aircraft utilisation is one of the fundamental drivers of unit costs. As well as being important for unit ownership costs, it also tends to drive crew utilisation. Operational issues across Europe’s airports caused issues at least to some degree for all these airlines, but this was the first quarter for some time where aircraft utilisation got back to something like normal levels for the peak season. I’ve shown the figures that each achieved in Q3 on the next chart.
Norwegian topped the league table here, with Ryanair in second place. Wizz were third, but their longer than average stage length and young fleet should make this an area where they excel, as they have done in the past.

Source: Company reports, GridPoint analysis and estimates
Competitive implications
These performance calculations are interesting, but how important are they when it comes to assessing the competitive implications going forward?
In the past, the low-cost airlines largely avoided competing with each other directly. It was far easier to compete with higher-cost legacy carriers. But as the sector continues to grow, they are inevitably being forced into more head-to-head competition.
In the following chart, I’ve shown the extent of the intra-European capacity overlaps in Q3. I’ve adjusted for substitute airports, so I am treating a flight from Stansted to Bergamo as being an overlap with a flight from Gatwick to Malpensa.
Reading across the chart, you can see that 19% of Ryanair’s European seat capacity overlapped with EasyJet in Q3, 15% with Wizz and so on. Reading down the chart, you can see that Ryanair is everybody’s biggest competitor. 39% of EasyJet’s capacity overlaps with them, 37% of Wizz’s and a huge 59% of Vueling’s. Actually, there is one company for whom Ryanair is not their biggest competitor, which is Jet2. For them, their overlap with easyJet is now slightly bigger. As I mentioned earlier, Pegasus is not a particularly relevant competitor for the others. Following its bankruptcy and relaunch, Norwegian has become much more of a niche Scandinavian operator, with more limited overlaps to the other carriers.

Source: GridPoint analysis
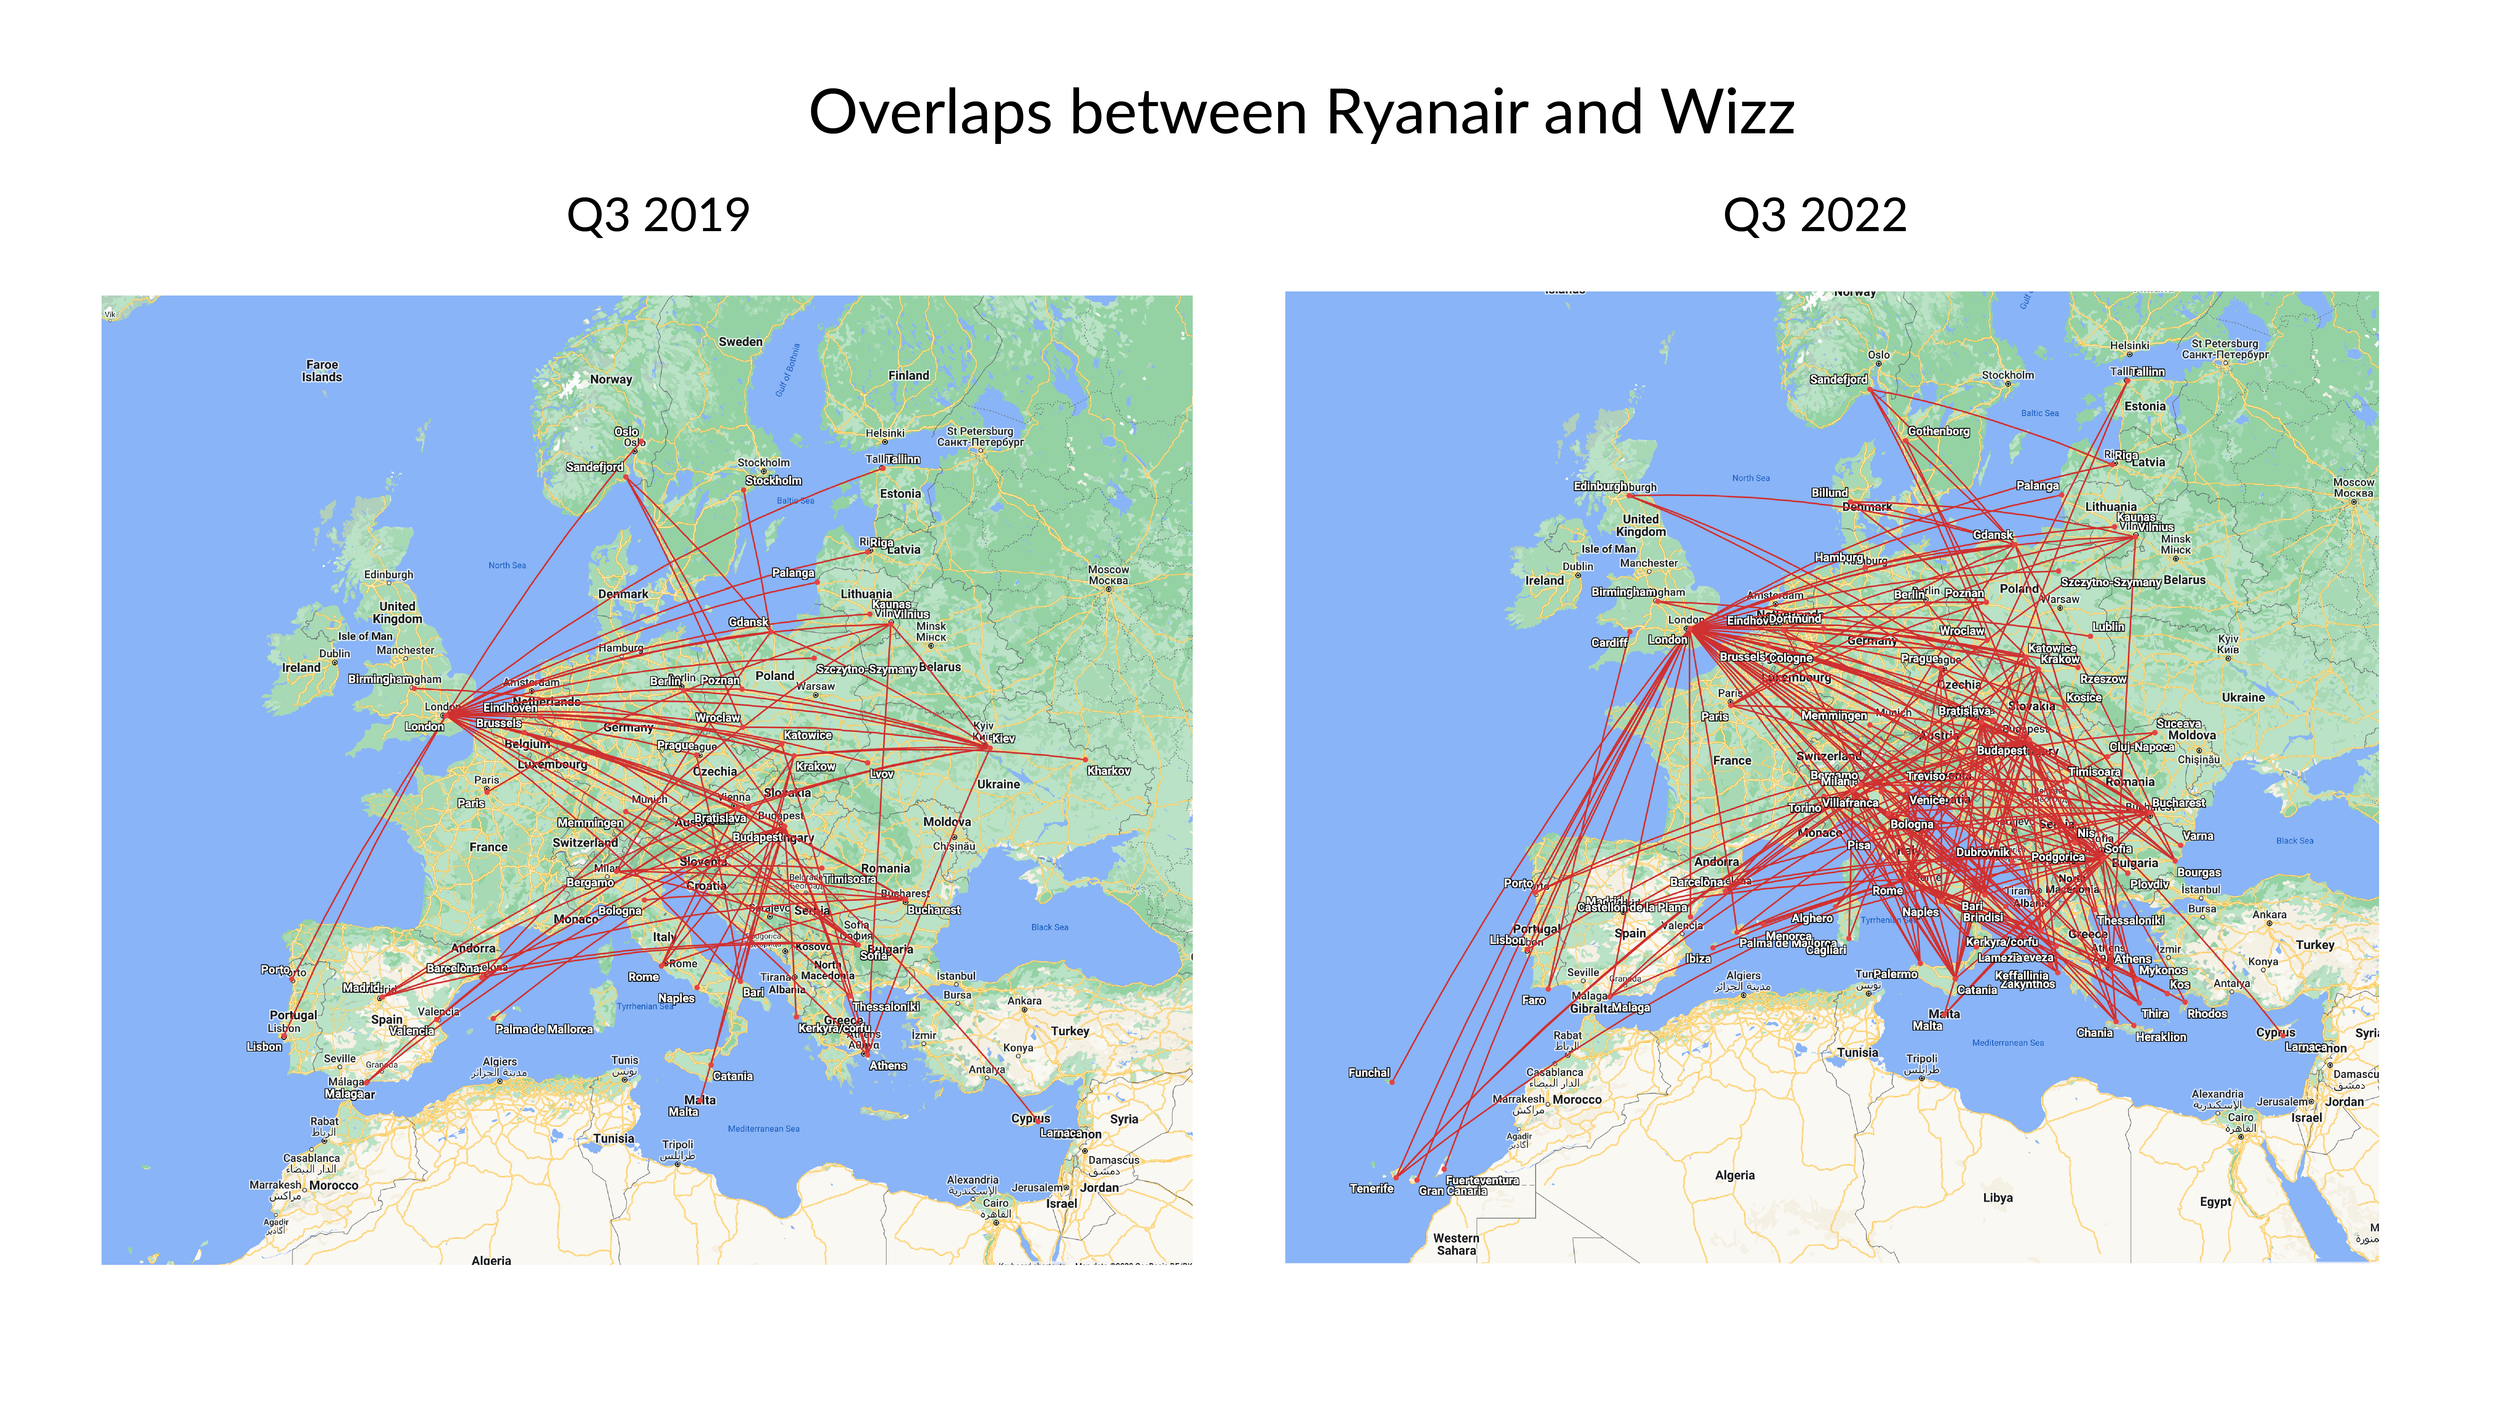
The previous chart also showed how these overlap percentages have changed since 2019 and you can see there have been some significant increases. Ryanair’s 15% growth has impacted most carriers, due to its size. But some of the biggest increases in overlaps come from Wizz, which is not much of a surprise, given its 30% growth in intra-European capacity since 2019. Before the pandemic, they overlapped with Ryanair on 86 markets, which represented 24% of their capacity. That’s grown to 211 markets, representing 37% of their capacity.
A large source of new overlap between Wizz and Ryanair comes from markets where neither were operating back in 2019. They both now operate on 43 city pairs that neither were flying back in 2019. They have both jumped in to fill the vacuum created by the collapse of Alitalia. Ryanair was already a significant player in Italy in 2019, and Wizz has started competing with Ryanair on many of those Italian routes. Wizz has also started competing with Ryanair on the Canary Islands. It total, 56 Ryanair markets have been entered by Wizz. In turn, Ryanair has come onto 65 Wizz markets, mainly in Eastern Europe, taking the fight to Wizz in its core territory.
I’ve shown below a map of the airport pair overlaps in 2019 and what those look like today. Both carriers have withdrawn from Ukraine, for obvious reasons. But you can see the increased scale of overlap in Italy, Eastern Europe and to the Canaries.
Source: GridPoint analysis
The overlap between easyJet and Wizz has grown too. But the difference in this case is that this has been almost entirely driven by Wizz coming onto markets where easyJet was already established. These 59 new overlaps are mostly a mixture of sunshine routes from London and routes from Italy, as you can see from the following map.

Can Wizz deliver its huge growth plans?
Wizz plans to grow from its current 160 aircraft to a fleet of 451 by the end of the decade. Since it flies larger aircraft, that would be about the size of Ryanair today in terms of seat capacity. To support those plans, it has ordered 304 aircraft to be delivered over the next five years, with capital commitments of $43 billion at list prices. It will have secured big discounts on those prices, so the real commitment is probably in the $20-25 billion range. But that is still a chunk of change for an airline with a negative equity position on its balance sheet and which only made a pre-tax profit of €61.4m, in what is the best quarter of the year.
We’ve also seen that Ryanair doesn’t seem content to allow Wizz to expand and try and usurp its place as the undisputed top dog of the European short-haul market. The two companies are increasingly clashing in the market, and Ryanair appears to hold all the cards when it comes to balance sheet strength and a superior cost position. For a year in which Wizz expects to lose at least €384m, Ryanair guided the market to a net income expectation of €1-1.2 billion.
Affording large capital expenditures on aircraft has been made more difficult by the strength of the dollar. Except of course for Ryanair, which revealed in its results announcement that it had fully hedged the cost of its own aircraft commitments over the next 18 months at a €/$ exchange rate of 1.24, locking in superior aircraft costs to further strengthen its cost position.
Whilst they remain resolutely bullish, the Wizz management team did signal something of a change of focus going forward. They said that 97% of future growth in Europe will be from existing airports and also devoted considerable airtime to their plans to expand further eastward into the Gulf region, building on their still-nascent business in Abu Dhabi by adding Saudi Arabia as the next target for growth.
Place your bets
You have probably detected that I am something of a sceptic about Wizz’s prospects going forward. But assuming it can fix its issues with aircraft utilisation, crew productivity, improve its load factors and ticket yields, and avoid further mis-steps on fuel and currency hedging, it is probably the only player in Europe with a chance to challenge the dominance of Ryanair.
Wizz is pinning its hopes on its better access to new generation aircraft being a winning card. Ryanair has not yet been able to secure the number of new generation aircraft that it wants, at prices it expects to pay. If future fuel prices are high and emissions costs continue to rise, that could be a decisive factor.
Other airlines won’t want to get caught in the cross-fire as the two contenders slug it out for low-cost leadership in Europe. They should probably be hoping that Wizz’s reorientation towards the Gulf goes well and that a big part of Wizz’s new deliveries end up there, rather than being deployed in Europe.