
More record profits at IAG in Q3
Another record quarter
Yesterday, IAG announced third quarter operating profits of €1,745 million, setting a new quarterly record, over 20% above the previous high set back in Q3 2017.
The pre-tax profit for the quarter of €1,578 million also beat the best ever Q3, a record set in 2018. However, the large amount of debt taken on during the crisis is still creating a drag on profits, with higher financing costs reducing the pre-tax profit increase to 11%.
Whilst the second and third quarters set new records, on a rolling 12 month basis, pre-tax profits are still slightly below pre-pandemic levels. But that milestone seems sure to be passed next quarter, with full year pre-tax profits likely to exceed the previous €3.0 billion record. More on that later in this post.
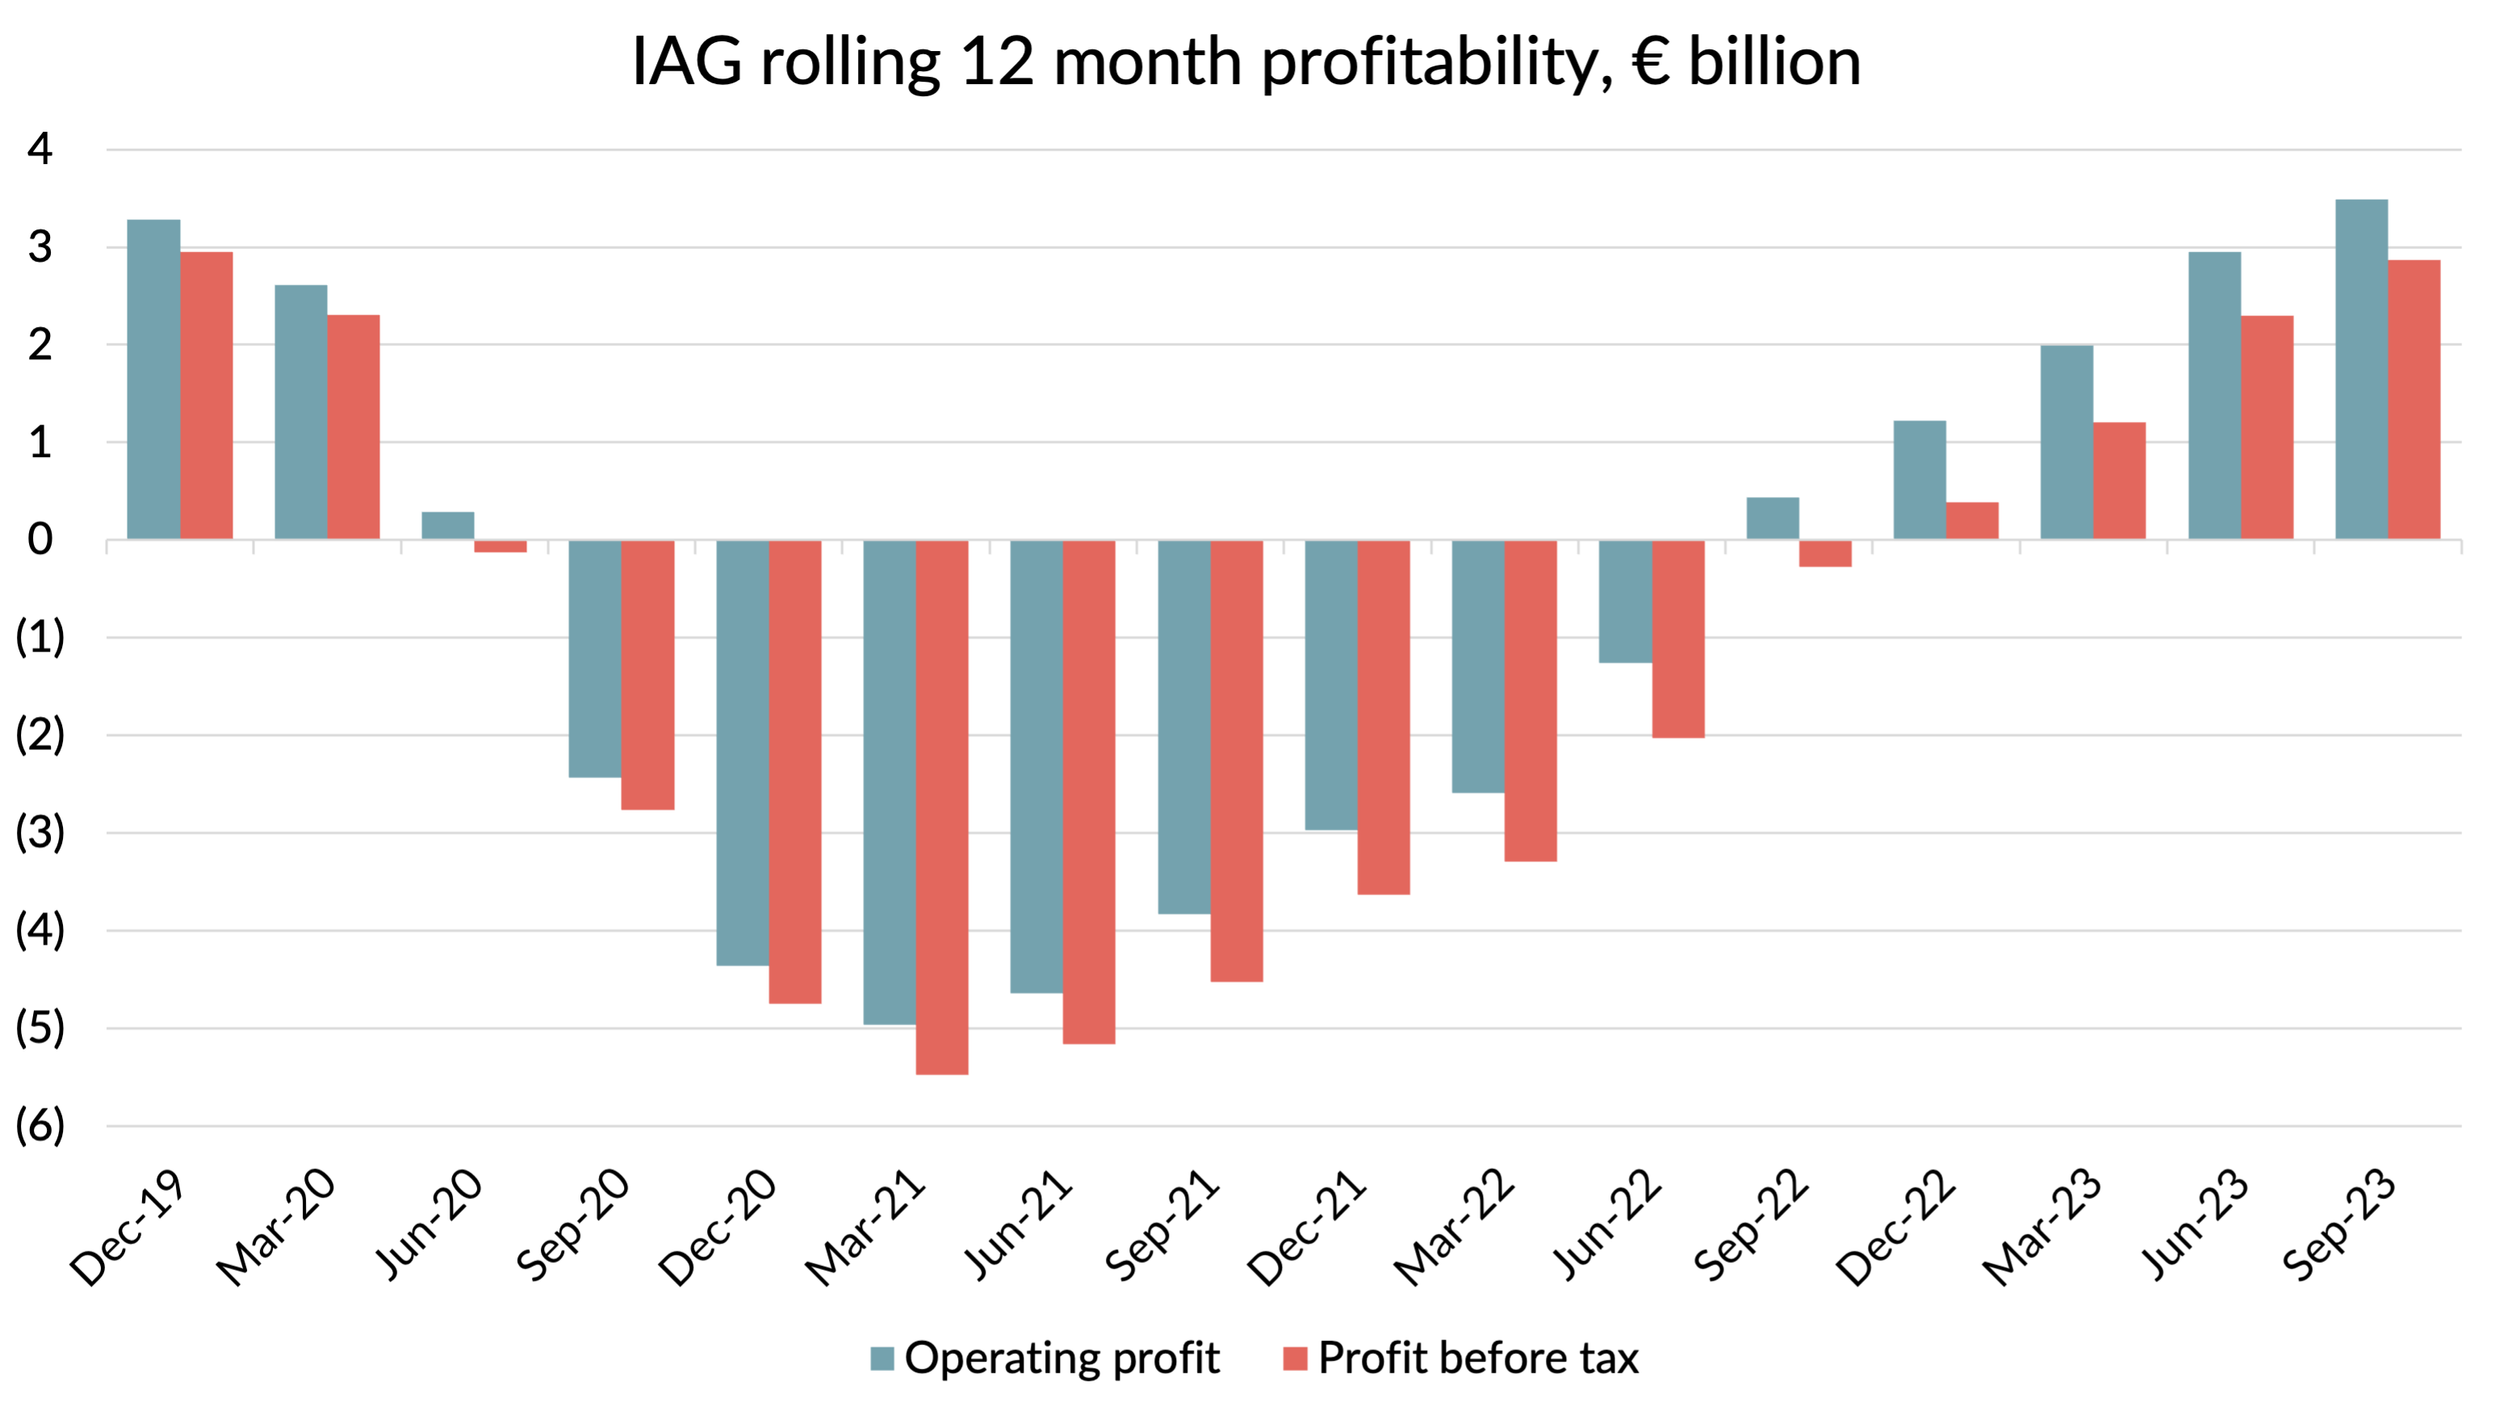
Of course, since the last records were set, there has been a big dose of inflation. Between June 2019 and June 2023, cumulative euro inflation added up to 17%. So on an inflation-adjusted basis, recent performance doesn’t look quite so impressive. But even allowing for this, it is fair to say that profits for the group have largely got back to pre-pandemic levels.
Performance by airline
This record-breaking performance has been achieved despite the fact that IAG’s traditional profit engine, British Airways, was still not firing on all cylinders. Over the last four quarters, BA’s operating profit has totalled £1.4 billion, still 28% down on the level of profits it used to make before the crisis.
The following chart shows the operating margin over the last four quarters (so Q4 2022 to Q3 2023). I’ve shown in grey the equivalent figure for the calendar year 2019. You can see that BA has gone from being one of the highest margin airlines in the group to one of the laggards.

Source: Company reports, GridPoint Analysis
The difference in performance was particularly striking in Q3, with BA’s operating margin of 15.3% over 10 points worse than the best performers Vueling and Aer Lingus. Some of that reflects the more seasonal nature of those two airlines’ markets, and averaged over the year the gap isn’t as big. As we saw in the previous chart, Iberia comes out as the best performing of the group’s airlines on a full year basis. That’s a big change from before the crisis, when it was bottom of the pack.

Why has the profitability ranking of IAG’s airlines reversed?
The obvious question to ask is why have IAG’s most and least profitable airlines swapped places? Is it driven by revenue or cost performance?
Let’s look at the headline figures for unit revenue and unit costs for the first nine months of 2023, compared to the same period in 2019. There have been some changes in average stage length, so I’ve adjusted the figures to try to eliminate that effect.
In the chart below, I’ve plotted the change in RASK (Revenue per ASK) and CASK (Cost per ASK) by airline. The dots that are above the line have grown RASK more than CASK, and therefore improved profitability. Those below the line have got worse.

Source: Company reports, GridPoint analysis
On this admittedly slightly crude measure, Iberia has done the best job on unit costs. That’s the main reason they’ve improved their performance so much. Aer Lingus has also done well on costs relative to the others, but this has been more than offset by poor revenue performance. Vueling’s unit revenue performance has been the strongest in the group and that’s the only reason they’ve improved profitability, despite a poor performance on unit costs.
You might think that BA’s higher dependence on the business travel market lies behind its relatively poor performance, but actually the RASK change is pretty good. It is the 24% increase in unit costs that has dragged it down. Some of that is due to a slower recovery of capacity. In the last nine months, BA’s capacity was still down 10% on 2019 levels, whilst Iberia’s was up 1%, Aer Lingus was up 3% and Vueling was up 6%. As the fastest growing airline in the group, that makes Vueling’s revenue performance all the more impressive (and its cost performance look even more disappointing).
Rather annoyingly, IAG didn’t provide any breakdown of BA’s costs in the Q3 figures. Normally, they split the costs into employee, fuel, depreciation and other. Was there something in that cost split that management preferred not to have to explain? I always find it a bit suspicious when a company suddenly decides not to disclose figures that they previously provided.
In any event, we do have some breakdown of costs for the first half of the year. That showed that BA’s employee costs were actually 4% below 2019 levels. OK, capacity was down 12% for that period, so unit employee costs were up. But it doesn’t seem to be employee cost inflation which is driving BA’s big unit cost increase, unless there was a massive jump in Q3. Neither is it depreciation. Those costs were down 13%, slightly more than capacity. Fuel costs were up 15%, but that’s a consistent story across the airlines. It was the “other costs” that seemed to be the source of the problem, up 35% on a unit basis. This is not a small cost category - it accounts for about €3 billion of costs on a full year basis.
What could possibly explain such a huge increase? Some of it will be accounted for by Heathrow airport fees. The 2023 fees allowed by the airport’s regulator on an interim basis were a cool 37% higher than 2019 levels. Those will be coming down a lot in 2024, now that the CAA has concluded its pricing review and finally recognised the recovery in passenger numbers. But Heathrow charges can only explain a fraction of the cost increases we’ve seen at BA. I guess we will have to wait until BA publishes its 2023 accounts next year to get some more clues as to what is going on.
Full year profit outlook
Earlier in the year, I questioned the company’s strange reluctance to admit how good 2023 profits were likely to be. At the start of the year, IAG gave guidance for an operating profit in the range of €1.8 to 2.3 billion. That always seemed ludicrously low to me. In my commentary on the Q1 results, I said a figure of €3.5 billion would be more reasonable. After the Q2 results, I increased my estimate to €3.7 billion.
On the Q3 analyst call, the company was questioned as to why they were still not giving any explicit guidance for profits. In response, IAG’s CFO Nicholas Cadbury said that the market consensus was for €3.2 billion, but that Q3 results had beaten consensus by about €200m and that that would likely “flow through”. Quite what he meant by that is not clear. Simply adjusting Q3 would get you to €3.4 billion. Replicating that outperformance in Q4 would take you to €3.6 billion. He also pointed out that if the company’s view was materially different from consensus, they would need to say so.
The Q3 results that have just been announced were about €200m better than I’d assumed when I estimated €3.7 billion for the year after the Q2 results. That was more than fully accounted for by stronger revenues. For what it is worth, my spreadsheet now has a figure of €3.8 billion in it for the full year. I think it could be better than this, maybe even hitting €4.0 billion, but with the company still speaking in riddles and apparently intent on talking down expectations, it’s hard to be confident.
The sorry state of IAG’s market valuation
At the end of 2019, IAG’s market capitalisation was €14.4 billion. Today, the market capitalisation stands at €8.1 billion. So despite a capital injection from shareholders of €2.7 billion, the business is worth €6.3 billion less. That’s a destruction of value of €9 billion, even if you ignore the time value of money.
Of course, the pandemic caused massive losses and resulted in a huge increase in debt. At the end of 2019, IAG had net debt of €6.4 billion and at the end of 2023, net debt will be around €9.2 billion, €2.8 billion higher. But the increase in debt accounts for less than half the reduction in market capitalisation so that’s far from the whole story.
Looked at in terms of enterprise value (market capitalisation plus net debt), this has fallen from €20.8 billion at the end of 2019 to €17.3 billion today. Normally, the ratio of Enterprise Value (EV) to EBIT should be a relatively stable reference point. As we’ve seen, operating profits in 2023 will likely be about 20% higher than they were in 2019. If the EV/EBIT multiple had stayed the same, the EV would have been about €7.5 billion higher. Or in simple terms, the share price would be almost twice what it is.
Another way of demonstrating how bombed out IAG’s valuation is would be to look at P/E multiples. My forecast for profit after tax for 2023 is about €2.7 billion. A market capitalisation of €8.1 billion gives a P/E multiple of 3x. The FTSE trades on an average P/E of about 11x at the moment and let’s not even talk about the 23x multiple of the S&P.
Basically, the market believes that IAG’s current profitability is not remotely sustainable and is about to collapse. Or perhaps nobody wants to own cyclical airline stock given the economic and geopolitical risks. Or maybe airlines are viewed as toxic investments, given the CO2 emissions. Probably a mix of all of these.
At this point I should remind everyone that I am not giving investment advice. If I’ve learnt nothing else from 30 years in the industry, I’ve learnt that the next crisis is always just round the corner and the best way to become a millionaire in aviation is to start off as a billionaire.
Capital markets day
The next big investor event for IAG will be the “Capital Markets Day” on November 21st. This will be the first such event since the pandemic and will be a major opportunity for the company to set out its stall as to why investors should buy the stock.
Let me suggest a theme song for the event: “The Only Way Is Up”.