
Comparing the balance sheets of IAG and Air France - KLM

A deep dive into the balance sheets of two of Europe’s biggest airline groups
Comparing the headline profitability numbers from the quarterly results of the European airlines is interesting as far as it goes. But from time to time I like to dig a little deeper and look at some of the less well understood parts of the financial statements.
Today, I want to look at Air France - KLM and IAG, both of which reported their Q3 results last week. Now that profitability has been restored, both companies are putting a lot of emphasis on improving their balance sheets, which took a pounding during COVID. So I think this is a good time to look at how the balance sheets compare today.
IAG only publishes a balance sheet at the year end and the half-year, so the most recent figures we have for them are from June 2023. Although we do have AF-KLM’s balance sheet for September, I’m going to focus on the June figures for both groups, as seasonality can be quite important on the working capital side.
In our journey through the balance sheets, let us start with the biggest asset of any airline, the fleet.
Fleet and other tangible fixed assets
These days, all aircraft end up on the balance sheet, either as fixed assets in “Property, plant and equipment”, or as “Right of use assets”, if they are operating leased. The figures for property, plant and equipment do include some non-fleet stuff like hangars and office buildings. But 90% of the value at both companies relates to fleet and the figures are only really broken down properly at the year end so I’m going to focus on the total.
The combined value of property, plant and equipment and right of use assets on IAG’s balance sheet in June 2023 of €18.9 billion was 6% higher than AF-KLM’s €17.8 billion, with the mix somewhat more skewed towards right of use assets.

Source: Company reports, GridPoint analysis
That lines up well with the difference in fleet size, with IAG having 5% more aircraft at the same date. To be honest though, it is a bit of a coincidence that the balance sheet asset value per aircraft is as close as it is, because there are some differences in fleet mix. As you can see from the next chart, the two groups have a very similarly-sized long-haul fleet. But on the short- and medium-haul side, AF-KLM makes much more use of regional jets than IAG does.

Source: Company reports, GridPoint analysis
More of IAG’s aircraft fleet is made up of “new generation” aircraft too - 28% are NEOs compared to only 17% at AF-KLM. Both those factors should push up the asset value per aircraft at IAG compared to AF-KLM. I think that the reason we don’t see that is the greater use of operating leases at IAG, with 55% of the fleet financed that way compared to 51% at AF-KLM. Right of use accounting doesn’t put the full value the aircraft on the balance sheet, which is what happens with owned or finance leased assets. If you want to learn more about how that works, I wrote about it earlier this year. In that article, I did some illustrative calculations which showed that a new aircraft costing $50m might only end up being shown as a $30m asset under ROU accounting. If you “gross up” the ROU asset values by that 50/30 factor, you would end up with an asset value per aircraft at IAG which is 9% higher than at Air France, as we might have expected given the different fleet mix.
Intangible assets
Whilst the accounting rules for aircraft and other property, plant and equipment can be a bit complex at times, for the most part the figures in that part of the balance sheet are relatively straightforward. Things are going to get a bit murkier now, as we venture into the world of “intangible assets”.
The chart below shows the values for June 2023, in grey. Next to that, I’ve shown the figures from December 2022, since both companies give a much better breakdown at the year end.

Source: Company reports, GridPoint analysis.
Note: ETS assets at AF-KLM were moved out of intangible assets from the start of 2023. The value for slots at AF-KLM include the value of trade-marks.
The easiest category of intangible assets to understand is software and IT development costs. Airlines spend a lot of money on these and the up-front costs are capitalised and written off over time, typically five years. The balance sheet values for those assets are quite similar, although IAG’s 24% lower asset value might be taken by some as evidence for a relative lack of investment, something the company gets criticised for in the popular media whenever there is a high-profile IT failure.
Also quite straightforward are ETS Assets. This is the value of the permits held under the EU and UK Emissions Trading Schemes. IAG’s ETS asset balance is 1.9 times the size of AF-KLM’s, or €197m higher. That is mostly explained by IAG’s bigger footprint for intra-European flying, which is 1.6 times that of AF-KLM. The rest I think reflects policy differences on the timing of when to purchase the permits. IAG bought all the permits required for 2023 before the end of 2022, whereas I don’t believe AF-KLM did.
The remaining categories of slots, brands/loyalty and goodwill all go together in a way. BA has purchased quite a few LHR and LGW slots over the years, and that value will end up here in intangible assets. But most of the €1.4 billion of slots on IAG’s balance sheet come from a process called “purchase price allocation”, relating to the acquisition of other airlines. When IAG bought the Heathrow based bmi back in 2011, a big chunk of the acquisition price was attributed to the value of bmi’s LHR slots. When IAG bought Aer Lingus, part of the purchase price was allocated to its slots, some to the value of the Aer Lingus brand and some to the value of the Aer Club loyalty scheme. Even the original BA/Iberia merger which created IAG was accounted for as an acquisition of Iberia. So the value of Iberia’s slots, brand and loyalty scheme at the time the deal was done also ended up here in intangible assets.
Goodwill is the bit of value left over after you’ve attributed the purchase price of a company acquisition to all the things you can quantify as having an independent value. That would include all the usual balance sheet entries for fixed assets, working capital and financial balances, and also the figures we worked out earlier for the fair value of slots, brands and loyalty schemes. Another way of saying this is when you buy a company for more than the sum of its parts, the excess goes into goodwill.
AF-KLM also has intangible asset values in its balance sheet for all of these acquisition related items, mostly dating back I think to the original AF/KLM deal. However, the total sum is dwarfed by the equivalent figures at IAG. That reflects IAG’s history as a much more acquisitive company over recent years.
It should be noted that much of the value of both companies’ slots, brands and loyalty schemes is still missing from the balance sheet. Because British Airways and Air France were considered as the acquiring entities, there is no value for their brands, loyalty schemes or for any slots they didn’t purchase. Only the values for companies that they merged with or acquired is included. And even for airlines that were acquired, any appreciation in the value of those items since the deals were done will also not be reflected. For the accountants, intangible assets are a “one way street”. You have to justify each year that the values haven’t gone down, and if they have, write them down. But you don’t get to write them up if there is missing value.
Working capital
The airline business is a negative working capital business. Airlines get paid by their customers more quickly than they have to pay their suppliers. In fact, most customers pay in advance. I’m going to come back to that last part in the next “deferred revenue” section, but for now I’m going to focus on the other parts of working capital. That is money tied up in inventories, and amounts billed to customers or owed to suppliers which have not yet been paid. The usual definition of working capital only includes “current” assets and liabilities, that is those that are due within one year. For reasons that will become clear shortly, I’m going to include non-current (non-financial) liabilities too.
The following chart shows the balance sheet value of those items, together with the total net figure. Even excluding deferred revenue, this part of the working capital was negative for both companies, with AF-KLM’s working capital a cool €2.8 billion more negative than at IAG.

Source: Company reports, GridPoint analysis
The €2.8 billion balance sheet difference compared to IAG was all down to the liability side of the equation. Simply put, AF-KLM owed a lot more money to other people. I’ve excluded all the financial balances, so these people are probably not getting paid for the use of their money, although maybe there are some suppliers who negotiated improved terms in the future in return for extending credit terms when the airlines were strapped for cash during COVID. As well as money owed to regular suppliers, this category also includes money owed to the government and to employees.
One of the large items making up the non-financial liability in the AF-KLM accounts is the “tax liabilities” balance. In the chart below, I’ve shown figures for it going back to 2018. To be clear, we are not talking here about corporation tax levied on the profits. This is money owned to the government for social charges and salary taxes. Before the pandemic, all these tax liabilities were “current”, meaning they had to be paid in the next 12 months. After the pandemic hit, a good chunk became “non-current”, so didn’t need to be paid for more than a year. The balance owed has grown as payments were deferred, and by June 2023 AF-KLM owed €1.2 billion more than before the crisis. At some point, AF-KLM will need to catch up on these deferred payments, but it looks to me like they are doing so at a rate of only €200m a year at the moment.

Source: Company reports, GridPoint analysis
We see something similar for the “employee liabilities” balance. That has also ballooned by €1.5 billion compared to pre-crisis levels. I don’t know exactly what is included here. Perhaps part of the social charges and salary taxes that the government has allowed to be deferred are recorded here. The portion of these liabilities that are becoming payable in the next year seems to be strongly on the rise, so this working capital benefit may disappear more quickly.

Source: Company reports, GridPoint analysis
Between the extra money owed in tax and employee liabilities, we’ve explained almost all the €2.8 billion of working capital benefit AF-KLM has compared to IAG. When AF-KLM normalises its payment position and this free money disappears, their net debt position is going to get worse by the same amount.
Deferred revenue
Both airline groups have massive liabilities in their accounts associated with cash they’ve received but which has not yet been reflected in the profit and loss account. This is revenue that has been “deferred” by the accountants because the related service has not yet been fulfilled.
The easy part to understand is for tickets sold in advance. Money received, flight not yet taken. When COVID hit and airlines had to cancel all their flights, the need to refund all those customers could easily have bankrupted the whole industry. The fact that airlines managed to persuade people to accept vouchers rather than refunds was a huge factor in the survival of many airlines.
The second big element relates to loyalty programmes. When airlines sell points to third parties (for example credit card companies), the revenue they receive is deferred over a period estimated to match the time it will take for the points to be used. In a similar way, when an airline issues points to one of its frequent flyers, a portion of the ticket price for that journey is deferred.
I’ve shown the balances for each company in the following chart. Note that I’ve shown these as positive numbers, but they are a liability in the balance sheet and they would have been shown as negatives in the previous working capital chart. I don’t have the split between the two elements for IAG at June, so I’ve included the December 2022 figures to give you an idea of how the number breaks down. Note that there is a big seasonal effect for both companies, with much higher amounts of tickets sold but not yet travelled in June, just before the peak summer travel season.

Source: Company reports, GridPoint analysis
We can see that IAG has substantially higher deferred revenue balances, especially those related to its loyalty programmes. At the end of 2022, IAG’s deferred revenue balance for loyalty was 2.6 times the size of AF-KLM’s. That’s mostly explained by IAG’s larger annual provision for points issuance, which in 2022 was twice AF-KLM’s. IAG’s more developed credit card partnerships drive a greater volume of issuance and the average price those points were sold at will be higher too.
The difference in annual issuance doesn’t fully explain the discrepancy in the size of the balance sheet provision. IAG has 3.5 years of annual issuance outstanding and AF-KLM has only 2.6 years. Part of the answer to this difference is that back in 2020, IAG pre-sold circa £750m of points to its credit card partner, Amex, as a liquidity enhancing measure. At the end of 2022, €326m of that was still outstanding. Adjusting for that reduces IAG’s provision to 3.0 years. Perhaps the rest can be explained by the mileage expiry rules, with IAG expiring miles after three years of inactivity compared to two at AF-KLM.
It is harder to understand why IAG’s sales in advance balance was 35% higher than AF-KLM’s at the end of 2022. It could just be that IAG is selling further in advance. But I did wonder if it could be related to higher ticket taxes in the UK. If BA collects those taxes on behalf of the government but doesn’t have to hand them over until the passenger flies, that could show up here as a working capital benefit.
For both companies, these balances are above pre-crisis levels, but IAG’s growth has been quite striking. The positive view on this is that it reflects rapid growth in the loyalty business and those deferred revenues contain a big profit margin element that is yet to be released into the P&L. Also, that the big growth in advance sales shows the strength of forward booked revenue. The counter view would be that IAG has been selling huge numbers of points and seats for cash, but has yet to incur the cash costs. So whilst this growth has been good for cash so far and should be a positive sign for future profits, there could be a negative cash consequence still to play out.

Source: Company reports, GridPoint analysis
Employee benefits
Another big category on the balance sheet relates to pensions. This is also a complex area, but I’ll do my best to summarise and explain the differences.
IAG is famous for the scale of the pension fund issues it has had at BA, with massive deficits being reported and large deficit payments being required to try to plug the gap. So it might come as a surprise to some that pensions shows up as a €1.7 billion net asset on the IAG balance sheet. In contrast, AF-KLM reports a €1.6 billion net liability.

Source: Company reports, GridPoint analysis
What explains the unexpected health of the pension fund balance in IAG’s books? In part it is down to differences in the way the accountants value pension liabilities in IAG’s accounts, compared to the way the actuaries value them in the periodic fund valuations used to set funding requirements. The accountants discount future cash outflows to a value today using the corporate bond rate, whilst the actuaries use rates more closely aligned with government debt, which leads to a bigger estimate of the liability. The many years of deficit payments has also helped of course. Eventually, if you pour enough money in, some of it will stick. But a big factor is the rise in interest rates. However you measure things, the present day value of future pension payments is much reduced, and this has given a big uplift to the funding levels of defined benefit pension funds.
In any event, even the actuaries now agree that BA’s main pension fund, NAPS, is in surplus and so deficit payments have ceased. Given that a pension fund is a “one way street” for companies, where money can only ever go in and never comes out again, it seems a bit weird to me to show BA’s pension funds as an asset for the company. But at least the issue seems to have gone away as a drag on BA’s cashflows and balance sheet.
KLM also had a defined benefit pension plan. That was turned into a defined contribution plan last year (perhaps at just the wrong time?). In any event it no longer shows up on the AF-KLM balance sheet. As far as I understand it, Air France’s scheme is more of an unfunded “pay as you go” scheme, topping up more generous state benefits. So it shows up as a liability in the books.
Provisions
There is one more major balance sheet item that we need to talk about before we get onto the net debt side of things., and that is provisions. These are costs that have been put through the profit and loss account to provide for future outflows. Most of the values here are fairly small, but there are two that are worth mentioning.
Both companies have huge provisions in their books for the cost of returning aircraft at the end of their leases (the AF-KLM number here includes maintenance provisions for leased aircraft). AF-KLM’s figure for that is €1.5 billion bigger than at IAG. Which is a bit strange, considering that as we’ve seen, IAG is a bigger user of operating leases. I don’t know whether IAG has less onerous return conditions than AF-KLM does, or whether they are just making less conservative assumptions.
IAG has a €680m employee cost provision, which relates to an option that a group of pilots and cabin crew have to “retire on the payroll” at aged 60 until they reach state retirement age. I think that’s a legacy Iberia thing.

Source: Company reports, GridPoint analysis
Net debt
A huge part of the balance sheet is of course made up of all the financial balances. IAG does provide net debt figures on a quarterly basis, so I’ve been able to give the Q3 numbers here too, although I can’t split the debt between the loans and the leases.
You can see that AF-KLM’s net debt is about €3 billion lower than IAG’s. Whilst IAG doesn’t have a huge amount of debt in the form of loans or bonds, it has a much bigger lease liability than AF-KLM. In Q3, IAG used some of its considerable cash balances to pay off the £2 billion (€2.3 billion) UK Export Finance backed loan that it took out during COVID, shrinking both sides of the net debt calculation.

Balance sheet equity
When you add up all the assets on the balance sheet and deduct all the liabilities, what you are left with is the equity. It is the accountants view of how much of the asset value is left for shareholders.
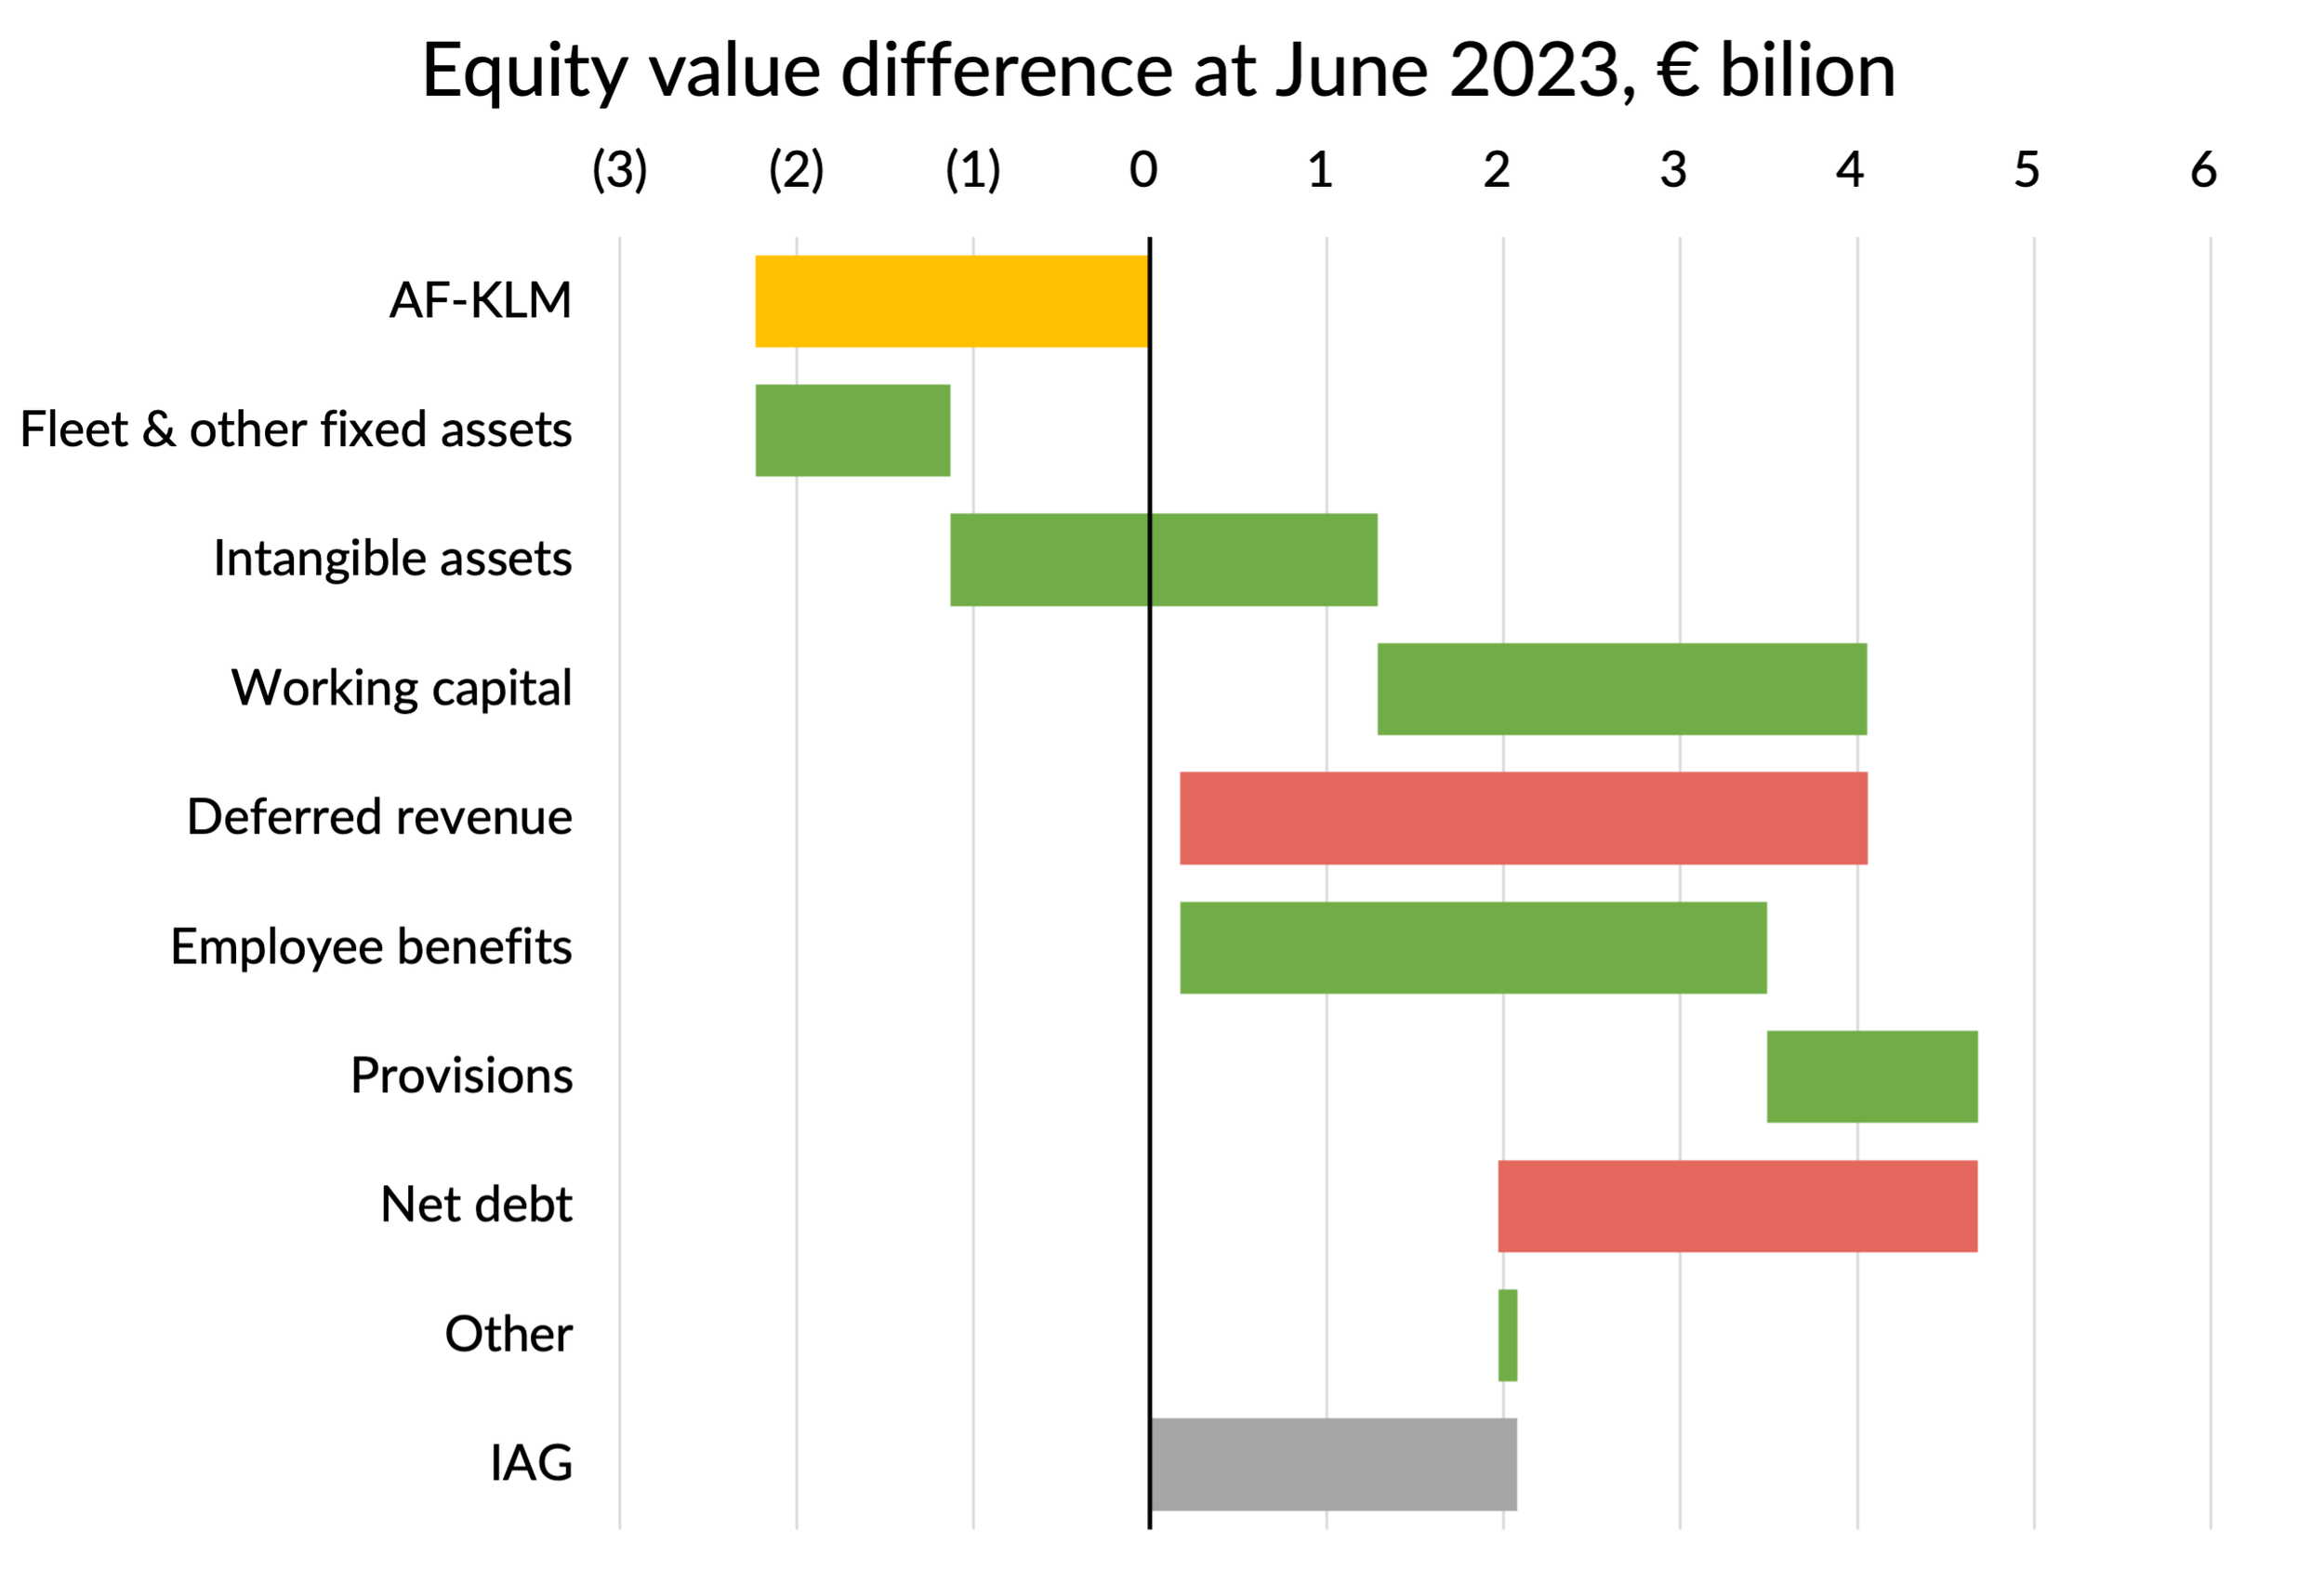
In the discussion above, I haven’t covered every line in the balance sheet. There are some assets and liabilities related to derivatives and some investment assets. But in Q2, these weren’t huge and the differences between the companies weren’t very interesting. So it is time to put together all the differences between the two companies that we’ve covered and try and explain how IAG manages to have a €2.1 billion positive equity value, €4.3 billion better than AF-KLM’s negative equity of €2.2 billion.
I’ve attempted to illustrate this in the following “waterfall” chart. We start with AF-KLM’s negative €2.2 billion figure. IAG has €1.1 billion more fleet and other fixed assets, €2.4 billion higher intangible assets and €2.8 billion more working capital. It then falls back due to deferred revenue liabilities which are €3.9 billion higher. IAG gets a €3.3 billion net gain from employee benefits and another €1.2 billion from lower provisions. Lastly, IAG’s net debt is €2.7 billion higher and the other items we ignored are worth €0.1 billion in total.
Simple really.
Does having negative net equity really matter?
As we’ve seen, not all of the assets of the business are included in the accounts. The value of the slots, brands and loyalty programmes are partially included at best. So the accountants view of the net worth of the business is a highly imperfect one. Most businesses are valued on their ability to generate profits and cashflows in the future, not the net value of their assets and liabilities.
But the accounting equity position does tell you something about how indebted a company is relative to the value of its assets, and a negative equity position can act as a legal bar on paying dividends. In France, having a negative accounting equity is more problematic from a legal perspective than it is in the UK, which is why AF-KLM has been working hard to get its equity value back into the black.
You can see from the following chart that it has been making some progress, largely through raising additional capital. IAG’s relatively stronger position post COVID is mainly down to having started in a much better place in 2019, thanks to a much more profitable history. With the additional capital raising measures that we’ll discuss in the next section, AF-KLM is confident that it will be back into positive equity by the end of this year.

Source: Company reports, GridPoint analysis
Which company has the stronger balance sheet?
Does IAG’s stronger equity position automatically mean it has a stronger balance sheet? We’ve seen that quite a chunk of the difference is due to higher intangible asset values. When it comes to more solid assets against which to secure debt, we’ve seen there is not so much of a difference. When assessing the strength of the balance sheet, many analysts understandably focus on the debt and cash figures. IAG’s €3 billion higher net debt figure could be taken as a sign that its balance sheet is more stretched than AF-KLM’s.
But I think we need to talk about what AF-KLM has been doing with the use of “quasi-equity” funding. These are bonds on which AF-KLM needs to pay interest, with the latest deal having a financing cost of 6.75%. That’s quite expensive compared to secured debt or lease finance. If fact the cost will be higher if they don’t repay the bonds in four years’ time. The rate “steps-up” by an undisclosed amount after that date. The reason the rate is high is because these are “perpetual” bonds, with no requirement to repay the principal. That’s how AF-KLM has been able to get the accountants to treat the bonds as equity, not debt. But be in no doubt that the step-ups in the interest rate will be designed to ensure that AF-KLM is highly incentivised to repay the bonds in four years. In substantive terms, is this equity, or is it debt? For permanent capital, it doesn’t seem very permanent.
In the Q3 balance sheet, there was already over €1 billion of such quasi-equity, which came from two earlier deals with Apollo Global Management, each for €500m and secured on spare engines and maintenance components. If you were to treat that quasi equity as quasi debt instead, AF-KLM’s net debt would worsen accordingly. In the Q3 results, AF-KLM announced another quasi equity deal with Apollo for up to €1.5 billion, secured this time on cashflows from the loyalty scheme. That will take the total to €2.5 billion and the company has said they may issue up to another €1 billion.
You’ll remember that AF-KLM have almost €3 billion of deferred tax and employee liabilities which it will need to pay back soon. I’m sure the quasi-equity capital programme is part of how they plan to do that. But you could make the case that AF-KLM’s real net debt position is actually €4 billion worse than it appears, if you adjust for these €3 billion of deferred liabilities and treat the existing €1 billion of perpetual bonds as debt.
Debt affordability
There is only so far you can go in assessing the financial strength of a company by looking at the balance sheet. The affordability of any given debt burden is critically dependant on profitability. In deciding how much they will lend, mortgage companies look not only at the value of the house that is being financed, but also at the salary of the borrower.
Although similarly sized in terms of revenue and capacity, IAG generated profits before financing costs which were 67% bigger in the first nine months of 2023, with profits averaging €400m per quarter higher. That higher level of profits is more than enough to support an extra €3 billion of debt.
The ratings agencies seem to agree and at the Q3 results, IAG announced that S&P had restored the company’s investment grade rating. I don’t believe that AF-KLM has a rating at all, but I’m confident it wouldn’t be an investment grade rating if it had one.
The other thing to look at is the actual market value of each company’s equity. At today’s share prices, IAG is worth €8.5 billion and AF-KLM only €2.9 billion. Both valuations are incredibly low compared to current profit levels, presumably because the market doesn’t believe that those profits are sustainable. If valuations for “legacy airlines” were better, AF-KLM would have been able to raise more normal equity capital, rather than being forced to resort to the quasi variety.
I’m sure that AF-KLM’s management team will be hoping that by the time the quasi equity needs to be refinanced, airline shares will be more highly valued and the company may have a better track record of profitability to support the valuation too.
In the end, there only so much that can be achieved with clever financial engineering. The old-fashioned business of controlling costs and selling tickets will have to do most of the heavy lifting of improving both companies’ balance sheets over time.