
A roundup of post-pandemic European airline results
Performance for the year ending March 2023
With the release of results last week from Wizz, we now have figures from all the big European airlines up to March 2023.
Whilst March isn’t a year end for many of these airlines, we have decent data for everyone for the twelve month period. It is a half year for easyJet, so we get reasonable disclosures there. All the other airlines report good data quarterly. The March quarter in 2022 was the last quarter seriously compromised by COVID, so the twelve month period to March 2023 represents the first full year of “post-pandemic” performance. For the first time since 2019, we therefore have a set of fairly “clean” full year figures to compare for Europe’s biggest airline groups.
What do they show? Let’s start with the question of size. Who is the biggest?
Size comparison based on capacity as measured by ASKs
I’m going to start with aviation’s most basic measure of size, Available Seat Kilometres (ASKs). This is the total number of seats, multiplied by the average distance flown. Most people would agree that flying bigger aircraft makes you a bigger airline, and so does flying further. A seat or passenger flown to New York beats one flown within Europe when it comes to measuring the volume of activity. ASKs capture both of these dimensions of size, at least as far as passenger operations are concerned. The following chart shows the biggest airline groups in terms of ASKs operated to, from or within Europe. On the basis of this metric, IAG and Air France-KLM were in an almost dead heat as Europe’s biggest airline group in the year to March 2023. Based on published schedules, which is what I’ve used in the chart below, IAG is 0.2% bigger. Using reported ASKs, AF-KLM is 2.9% bigger. If we used reported RPKs, which also reflects differences in load factors, AF-KLM’s advantage increases to 6.5%. So probably we should give the honour of Europe’s biggest passenger airline group to AF-KLM.

When it comes to intra-European flying (the blue bars in the chart above), Ryanair is of course number one by a large margin. They are about twice the size of the the next biggest airline groups, with IAG and Lufthansa Group vying for number two status and easyJet only a little bit behind those two.
In my ASK comparison, I included European flying by airlines not based in Europe. Emirates is the only one of these big enough to make it into the top eight. For all the other airlines, every flight in their system features a European airport as either an origin or a destination. But for Emirates, 65% of their capacity doesn’t touch Europe. If you were to include all of Emirates’ capacity, they would be about the same size as IAG and AF-KLM. Since I want to focus on airlines based in Europe in this article, I won’t be talking about them further.
Before we move onto other size metrics, I want to say a few words about the Wizz ASK numbers. As I mentioned before, the figures in the above chart are based on published schedules and are calculated on a comparable basis. The published number of flights in the period is multiplied by the seat capacity of the aircraft operating that flight and by the distance flown, as measured using great circle distances. These figures are never going to be identical to the numbers reported in company accounts, for example due to last minute cancellations or aircraft type changes. But for all the airlines here except one, they are very close. Typically 1-2% different. The one airline where the figures don’t line up is Wizz, where the reported ASKs are 10% higher. If you compare the reported figures for the number of flights and the number of seats operated, the discrepancy is very small. So the difference arises in the numbers for the distance flown. The only explanation I can offer is that Wizz may be reporting based on actual distance flown, rather than great circle distance, which I think is used everywhere else. Actual distance flown will be greater than great circle distance, since air traffic control does not always allow airlines to fly the shortest routing. The war in Ukraine and constant ATC strikes in France are causing more issues than usual too. If that is what Wizz are doing, then on a “like for like” basis they are understating their reported unit costs (they focus on “Cost per ASK”) and also overstating their fuel efficiency (they use “CO2 per RPK”). To be clear, I’m not saying that there is anything wrong with using actual distance flown per se, just that if that is what they are doing, this isn’t made clear in their accounts and would be non-standard. Given that it would have the effect of flattering their highest profile performance metrics, I think that is quite important. But maybe there is another explanation, so I’ll give them the benefit of the doubt and use their reported ASK figures for the rest of this article.
Who is biggest based on revenue?
In the chart which follows, I’ve shown the figures for passenger and total revenue for the year to March 2023. Looking only at passenger revenue, you can see that Air France - KLM, Lufthansa Group and IAG are remarkably similar in size, with Air France - KLM again taking number one slot. Lufthansa Group climbs to the top of the chart on the basis of total revenue, thanks to the size of their cargo, third party MRO and catering businesses.

Ryanair, Europe’s favourite airline?
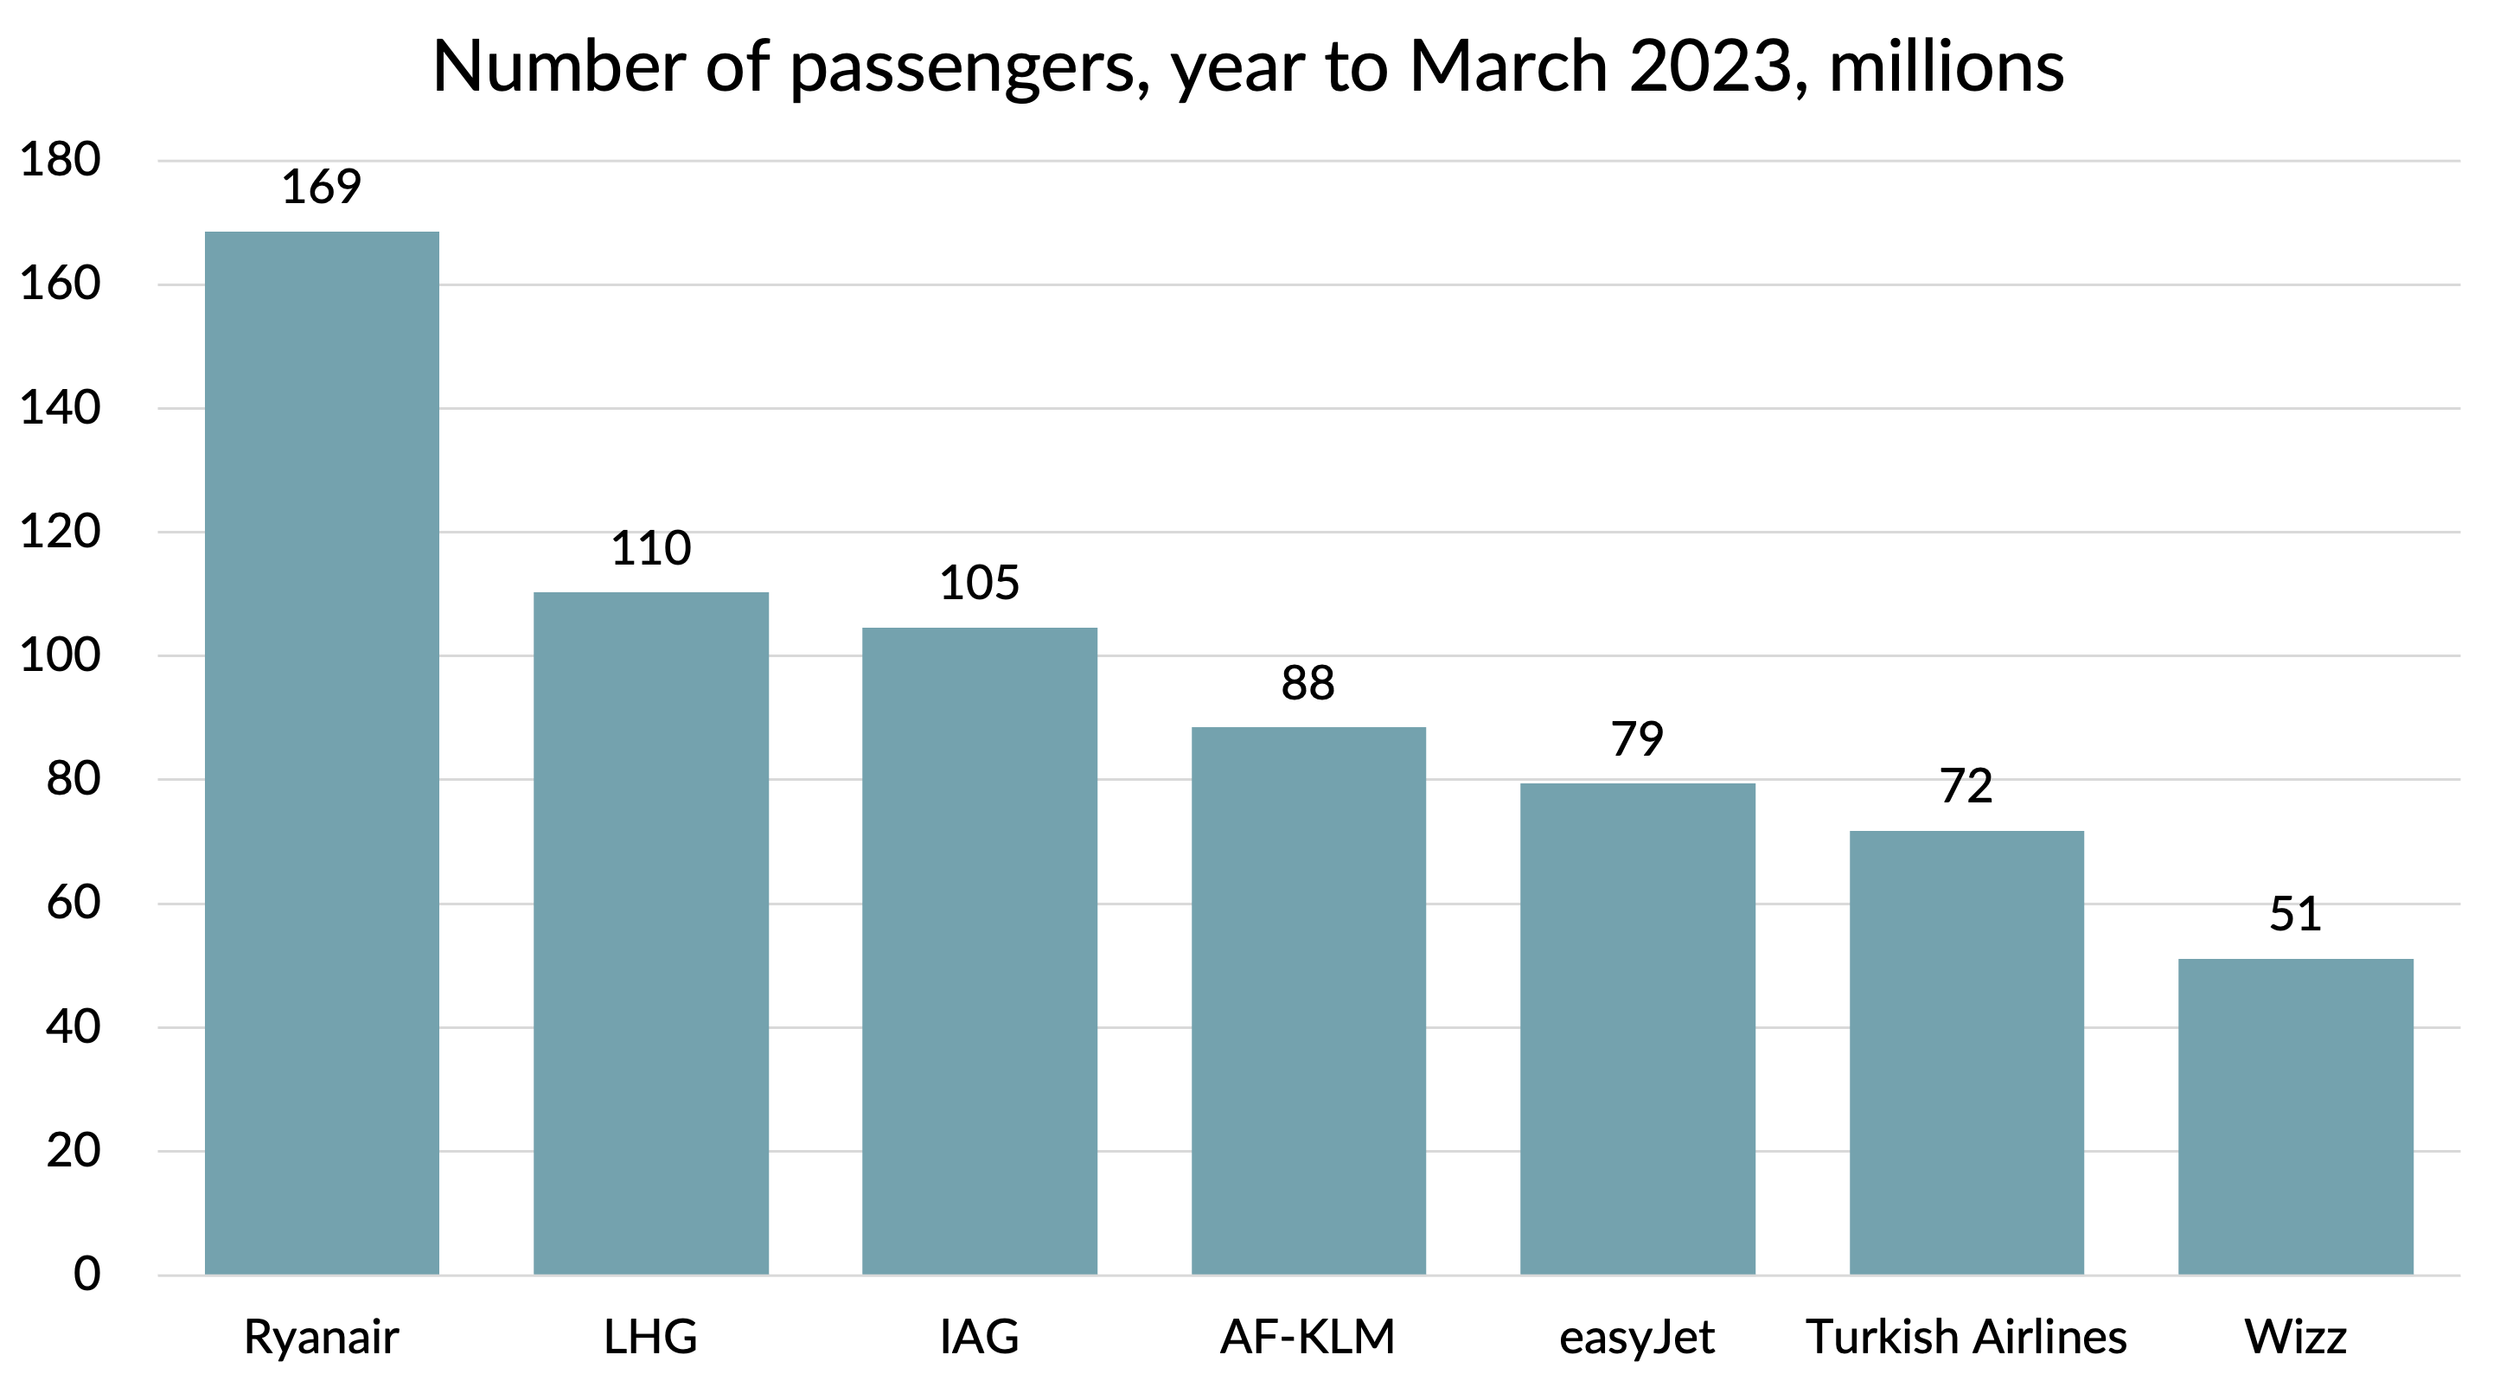
Ryanair styles itself as “Europe’s favourite airline”, a title it claims on the basis of being the the number one European airline, as measured by passenger numbers. Whatever you think of that metric as a measure of size or popularity, with 169m passengers in the year to March 2023, they are quite a way ahead of the other airline groups. If you consider only single airline brands, rather than adding together the figures for the brands within the multi-brand groups, then they are even further ahead. So I don’t think they are going to be getting the advertising standards authorities knocking on their door any time soon.
What about profitability?
As the saying goes, size isn’t everything. In business, profits matter more. Which airline groups win the awards for profitability?
Amongst the Western European airline groups, Ryanair came first on most metrics. Its pre-tax profits of €1.6 billion were the largest in absolute terms, beating the €1.2 billion reported by both IAG and Lufthansa Group. But it was soundly beaten by Turkish Airlines, which managed a whopping €3.2 billion. I haven’t ever analysed Turkish Airlines results in any detail, so I don’t know if there are any issues of comparability or government subsidy (I did notice €200m of “income from investment incentives”, for example). I’m sure that hyperinflation in Turkey is also causing lots of accounting distortions too. But on the face of it, the performance of Turkish Airlines was very impressive. One factor could be that it is the only major European airline still operating to Russia.

Turkish is also number one in terms of reported pre-tax profit margins. But Ryanair does win out at an operating margin level.

One of the reasons Ryanair does so well in terms of profit margins is that their unit revenues are so low. From an investment perspective, return on capital invested would be a better measure of profitability. That is a complex subject full of arcane accounting issues, so I’m not going to go into that here. But I think you can get an idea of what it would show by looking at profit per unit of capacity. Whilst this isn’t a perfect metric by any means, I do think it gives an interesting perspective on relative profitability and doesn’t show Ryanair in quite such a favourable light.

Which airline group has the lowest unit costs?
You may have noticed that Wizz has consistently featured on the right hand end of the charts. It is the smallest and the least profitable airline group of the “big seven”, pretty much whichever way you look at it.
The three “claims to fame” that Wizz puts forward is that it was the fastest growing airline group in Europe, it is the most fuel efficient, and that it is (almost) the lowest cost. I’m not going to dispute the first claim. With 67% growth in the year to March 2023 and capacity 62% above 2019 levels, that is clearly the case. Their rapid growth has also given them an incredibly young fleet, and once you add high density seating configurations, that pretty much guarantees a great outcome for fuel burn per seat km. But what about their unit cost position?
In the following chart, I’ve shown three figures for cost per ASK (CASK) for each airline group. The first (marked “Headline”) uses the reported figures. For Lufthansa Group, I’ve used the Passenger Airline segment figures, which exclude the costs of the cargo, MRO and catering divisions. Those divisions would otherwise distort the figures, since those activities inflate the cost base without adding ASKs. I haven’t attempted to do the same for AF-KLM and IAG, since the scale of the distortion is less than at LHG and the level of disclosure is lower. So it is worth bearing in mind that LHG will be a bit flattered by comparison.
The second set of figures adjusts for stage length effects, since CASK goes down as flight distance increases. The final set also adjusts for aircraft configuration effects, essentially normalising for premium cabins at the network airlines. Premium cabins reduce ASKs without having a material impact on cost per plane, so I’ve adjusted the ASK figures to show what CASK would look like with an “all economy” configuration to show the underlying cost position. The cost comparisons between the network airlines and the low-cost players still comes with plenty of “apples versus oranges” caveats, but I don’t think anyone would disagree with the rankings and the main messages:
AF-KLM is the highest cost, with LHG in second place
IAG and Turkish are in the same ballpark as the other two network groups, but have lower costs
EasyJet is lower cost than the network airline groups, but is a lot higher cost than Wizz and Ryanair
Wizz and Ryanair are in a class of their own, but Ryanair is the lowest cost

We know that a big reason why Wizz’s unit costs were worse than Ryanair in the year was down to very divergent fuel hedging policies. I’ve had a go at adjusting the three low-cost airlines’ unit cost figures for fuel price differences. I’ve adjusted everything to Ryanair fuel prices, which doesn’t make much difference to easyJet’s figures but changes Wizz’s figures massively. It still leaves Ryanair able to claim the title of “lowest cost airline in Europe”, but Wizz get to within 5% on this basis. That’s true as long as you use their reported ASKs. If those are 10% overstated, as discussed earlier, the gap would be quite a bit bigger.

Choose your metric
Most of the big seven airlines can pick out metrics for performance in 2022/23 which they could present as giving them “number one” status:
Ryanair is the biggest airline by some margin for intra-European flying, is the lowest cost operator and has the highest operating profit margins of anyone.
Turkish Airlines is the most profitable airline in Europe on every measure apart from operating margin.
Air France - KLM is Europe’s largest passenger airline group in terms of revenue, RPKs and ASKs.
Lufthansa is Europe’s largest airline group by revenue.
IAG is the most profitable and lowest cost network airline group in Western Europe (i.e. excluding Turkish).
Wizz is the fastest growing airline group in Europe, has the lowest fuel burn per passenger km, and is the only airline which gets even close to matching Ryanair’s unit costs.
With the exception of Ryanair and Turkish Airlines, all of these airline groups will I’m sure be pushing to improve profitability in 2023/24. For Ryanair and Turkish, their profitability gives them the luxury of focusing on growth.
Wizz continue to be growth-oriented, but has begun to shift the priority more towards profitability. They need to show they can make money, as well as being fast-growing and low-cost.
EasyJet is the one airline group for which I can’t come up with any metric which would allow them to claim to be number one, based on 2022/23 performance. In terms of passenger numbers, they are the second biggest individual airline brand in Europe, they have some leading positions in individual markets, and they weren’t the worst performer when it comes to profitability. But it does seem to me they have a bit more to prove than the others going in 2023/24.