
The end of the beginning?
Q3 results for the big three US airlines have been released, what do they tell us?
More than six months into the crisis, the Q3 results for the big US airlines provide some perspective on how the industry is coping with the pandemic and the scale of the value destruction that has already taken place.
The pandemic is certainly far from over, with case numbers continuing to climb across the world and specifically in the US. However, US airline management teams now seem to be shifting out of a pure cash and liquidity focus and settling in for the long slow slog back to profitability.
Scott Kirby, United Airlines CEO summed things up with a Winston Churchill quote from November 1942:
“Now this is not the end. It is not even the beginning of the end. but it is, perhaps, the end of the beginning.”
It seems a good time to take stock on the financial results from the US industry over the last nine months. Whilst this does include a couple of pre-pandemic months, Q1 figures were already being impacted so I think it is important to include them.
I will start with the headline profit figures.
Income before tax
Between them, the big three US airlines clocked up almost $30 billion of pre-tax losses in the nine month period, with Delta leading the way with $14.5 billion of losses.
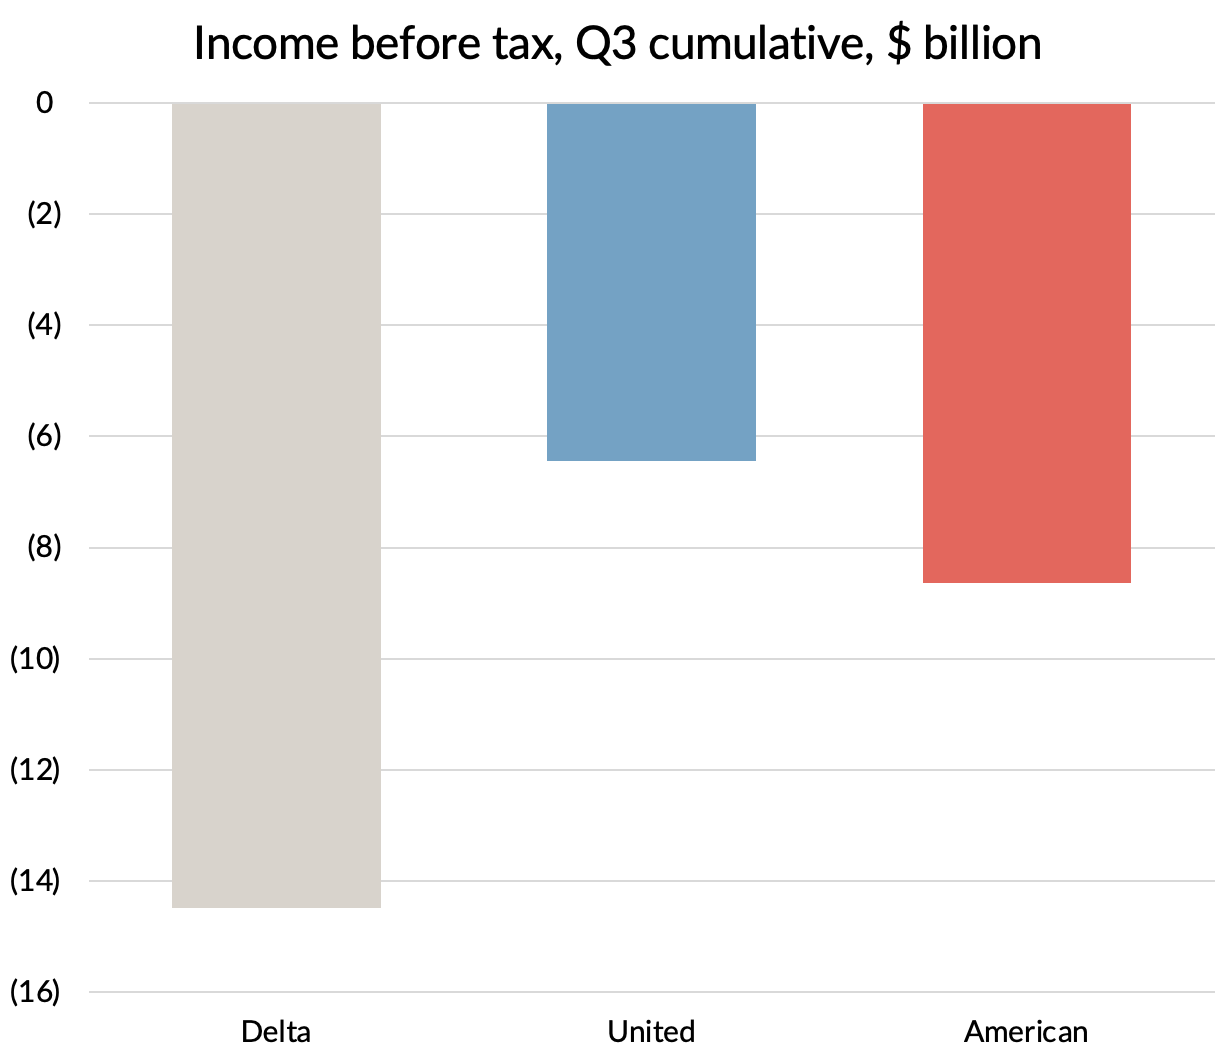
Source: Company reports
$6 billion of those losses came in the form of “special items”. There were $16 billion of “bad guys”: write-offs (for both aircraft and investments) together with provisions for severance and other restructuring costs. These were offset by almost $10 billion of non-refundable grants from the US government under the CARES act “Payroll Support Program”.
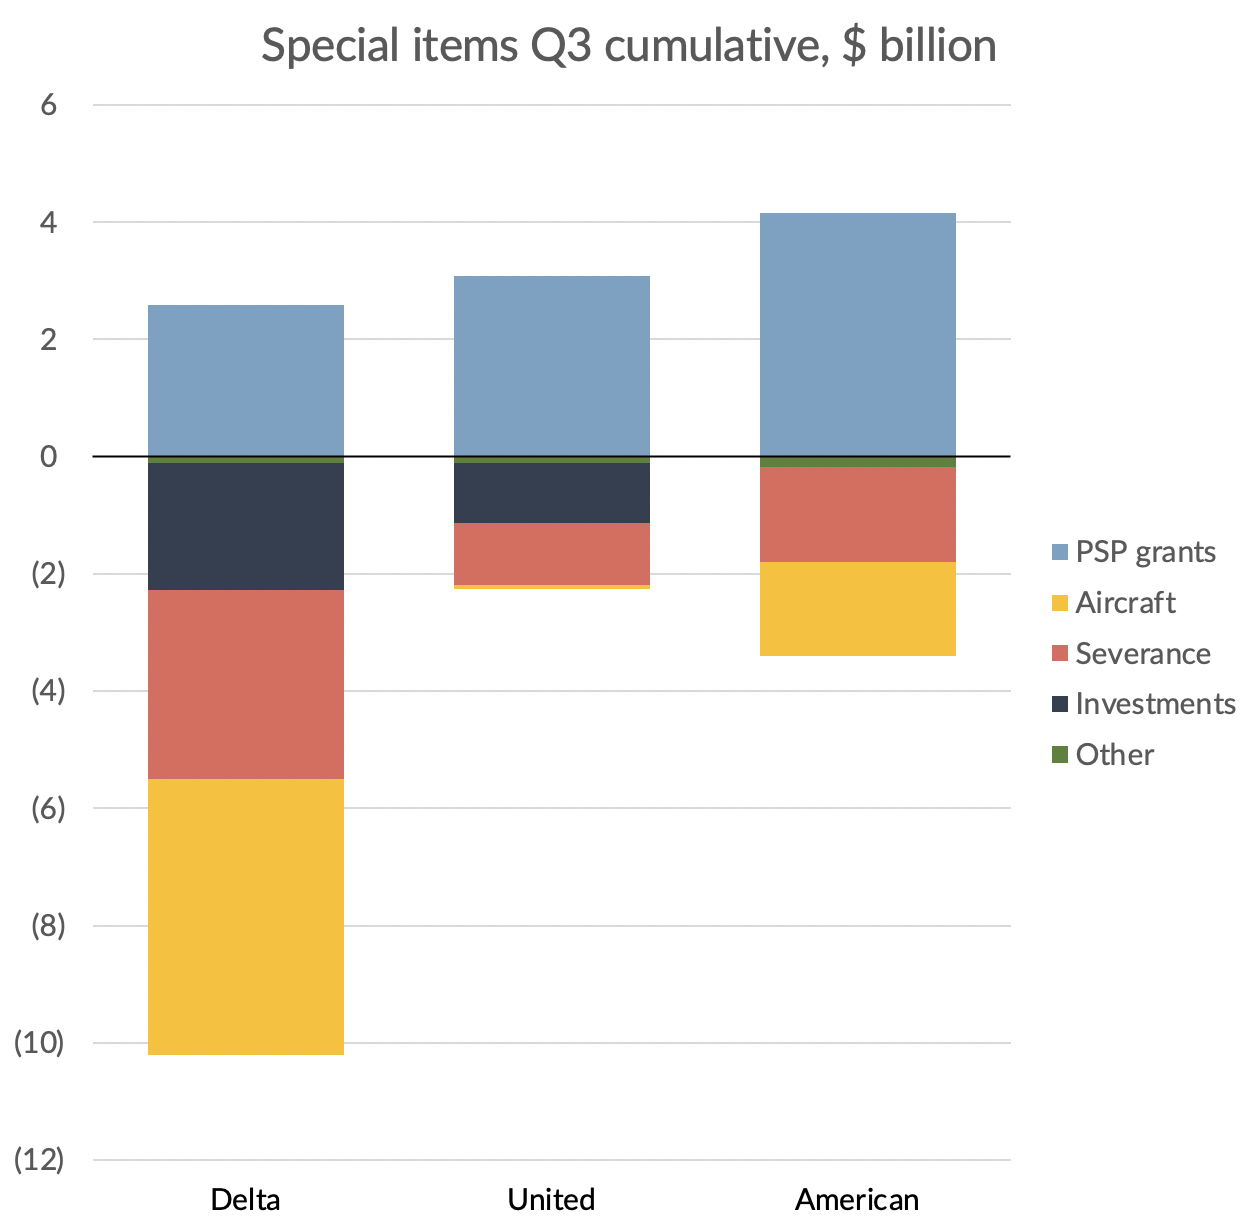
Source: Company reports. GridPoint analysis.
The PSP grant money was given to airlines mostly in Q2 with a little more in Q3. However, in profit and loss terms, the benefit has been spread over the quarters by the airlines, although each has taken a different approach. American Airlines released all the money to profit in Q2 and Q3, leaving nothing left to prop up their reported profits in Q4. United still has 13% carried over ($520m) and Delta spread theirs equally across the three quarters and so has $1.3 billion left to flatter their final quarter results.
Delta has made the biggest provisions for severance and early retirements, covering voluntary exits for 18,000 employees, about 20% of the total. Similar things have been done at American and United, although I couldn’t find accurate figures for how many people are permanently leaving the business. It seems to me that they are seeking to make more of their adjustment through temporary arrangements such as furloughs and unpaid leave. They have certainly made much lower provisions for the cost of exiting people.
Delta has also made the biggest aircraft write-downs, with $4.4 billion of provisions being made to cover the early exit of 383 aircraft. That’s a lot of aircraft, but then Delta has a big fleet. At the end of 2019, Delta had 898 aircraft and an additional 442 regional aircraft were operated by regional airline feeders. Many of these aircraft would have been retired over time anyway, so the provisions are in part about the cost of accelerating that.
American has also announced the early retirement of aircraft and written those aircraft down, but on nothing like the scale that Delta has done. As far as I can tell, United has not written down the value of any aircraft as yet. All three carriers have of course delayed deliveries which will help them adjust their capacity over time.
Overall, it seems to me that Delta has now pretty fully provided for the cost of permanently adjusting the size of the airline by 20%, whereas the other two carriers are taking more of a “wait and see” approach, utilising temporary arrangements until the post pandemic demand position is clearer. Maybe they are also waiting for their balance sheets to be in a better position to absorb large write-offs too.
Losses excluding special items
After adjusting income before tax to exclude these very lumpy special items, the airlines look a lot more similar to each other.
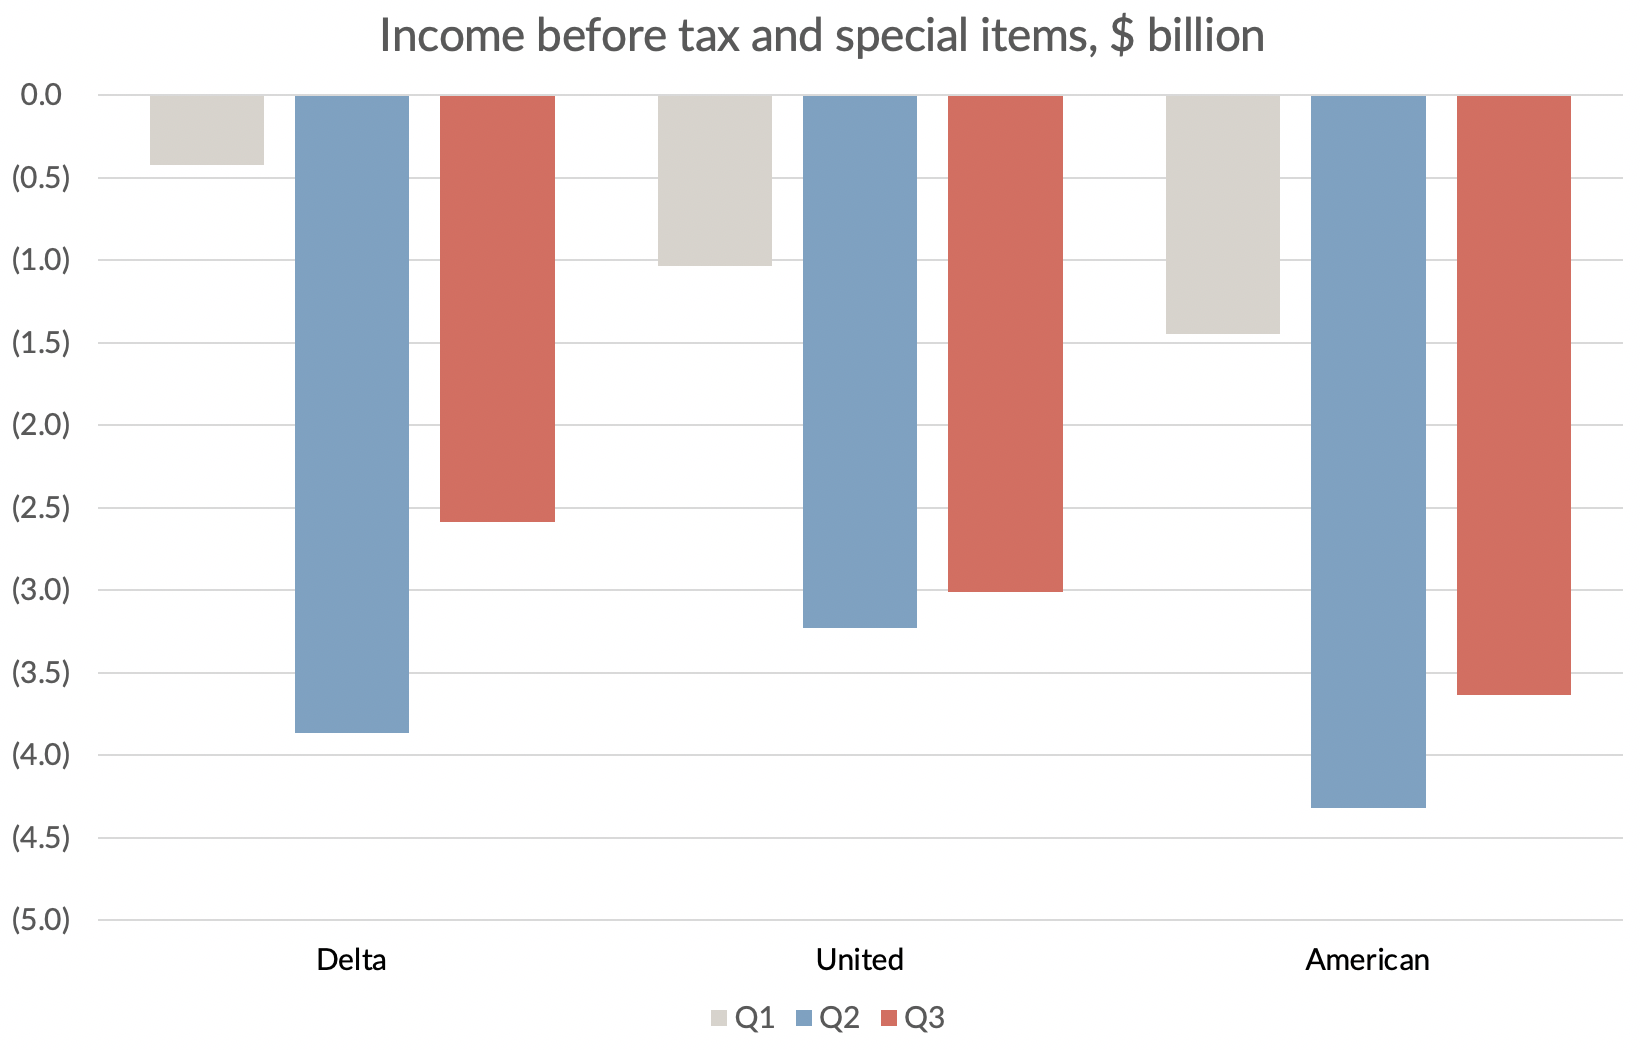
Source: Company accounts
The underlying trend in profitability from Q2 to Q3 is not that encouraging. For all three airlines, losses declined but there is still a long way to go to get back to breakeven. On their earnings calls, the management teams were all positive about a continued upwards trend in revenue going into Q4 and decent bookings for Thanksgiving. However, with the US COVID-19 case rate (7 day new cases per 100,000 population) back on the rise, they were all being cautious and confirming that they did not see a proper recovery coming until a vaccine had been deployed, now expected to take until the end of 2021.

Source: GridPoint analysis of data from the European Centre for Disease Prevention and Control
Cash burn and value destruction
I decided not to spend too much time on the cash burn figures. They all calculate them differently and from what I have seen, I don’t think there is too much to choose between them anyway. What I thought was more interesting was to look at the change in net debt from the start of the year. Taking out a loan or doing a sale and leaseback boosts cash, but doesn’t do anything for net debt. The money raised will need to be repaid at some point.
I think that the increase in net debt is a good proxy for the value destroyed during the first nine months. Of course, the true lost value is higher, since without the pandemic, these companies would all have been generating cash and creating value for their shareholders. To properly use it as an estimate for value lost, net capital expenditure and money raised from or paid to shareholders should be excluded too.
But the figures for increase in net debt are interesting in any event as there are some differences between the carriers. On a technical note, I’m defining debt to include all lease obligations on the balance sheet and defining cash to include restricted cash and short term deposits.

Source: Company reports, GridPoint analysis. Trading losses = op. loss before special items + net interest
You can see that taken over the three quarters, American lost rather more in terms of trading losses, which I’ve defined here as operating losses plus net interest costs. However, it actually came out best in terms of having the lowest increase in net debt. It received the biggest PSP grant, it raised the most from shareholders and it seemed to have the best working capital movement. Management did warn that many cash costs had been deferred from Q2 and Q3 into Q4, so this advantage seems likely to vanish shortly.
United also raised money from its shareholders, but it was the only airline where capital expenditure exceeded depreciation during the period. That is not easy to see from its financial statements as reported capital expenditure of $1.6 billion was below depreciation at $1.9 billion. However, United also had $1.5 billion of asset additions "acquired through the issuance of debt and other financial obligations". Sounds like capex to me. I’ve counted it as such and whatever you call it, it definitely contributed to increasing the net debt.
Delta also tried to flatter its net debt numbers by sale and leaseback antics. They sold and leased back $2.8 billion of aircraft and obviously wanted this to increase cash whilst not increasing debt accordingly. However, they didn’t manage to transfer the risks of ownership and so the accountants classified the leasebacks as finance leases, with the aircraft remaining on their balance sheet. They obviously had a bit of a row about this and the accountants have allowed them to bury the lease obligations under "other non-current liabilities". I'm less accommodating and have counted these obligations as debt, along with all the other lease liabilities on the balance sheet.
Using my definitions for debt, Delta had the biggest increase in net debt of the three at $7.3 billion. We’ve already seen that they’ve done more in making severance and aircraft provisions, but most of these were non-cash. The $2.3 billion increase in net debt from investments was driven by the money they sank into LATAM in Q1, just before the pandemic hit. When LATAM immediately filed for Chapter 11 bankruptcy, they were forced to write off the entire value of their 20% stake just one quarter later with a $1.1 billion write-off in Q2.
Oops.
Delta are still carrying the $1.2 billion balance of their Q1 LATAM payments as an "alliance-related indefinite-lived intangible asset". I'll place a small wager that the life of this "asset" proves not to be particularly indefinite.
Not very much of the severance provisions that Delta or American have made have found their way into cash yet and are unlikely to do so for quite some time. A lot of the provisions are for additional post-retirement and pension benefits. With neither carrier putting money into their pension plans at the moment, that is a cost that they clearly plan to address only over the long term.
Where does that leave each of the airlines?
It is a good thing that American had the smallest increase in net debt, as it was the most indebted going into the crisis.
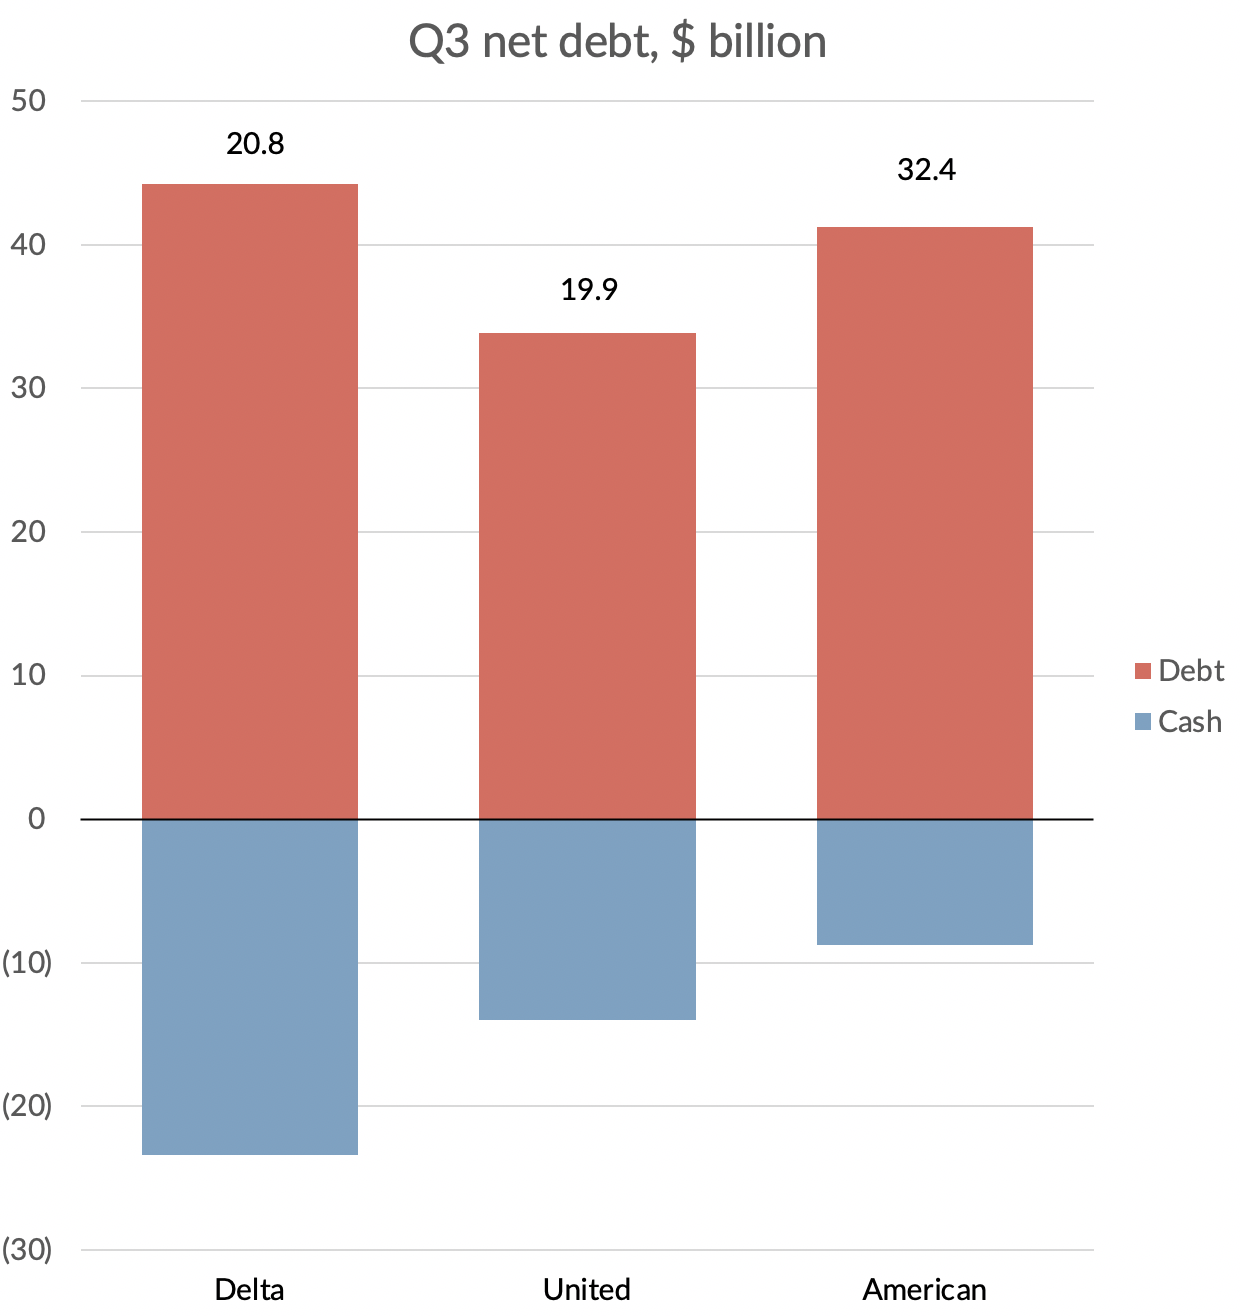
At the end of September, American had net debt of $32.4 billion, 55% higher than the second highest airline Delta. Its gross debt is actually slightly lower, but Delta has much more cash now ($23.4 billion).
United is in the middle when it comes to cash, but has quite a bit less gross debt and so in net debt terms it is quite similar to Delta.
Source: Company reports, Gridpoint analysis
How affordable are these levels of debt? If you compare net debt to the value of the aircraft and other fixed assets on the balance sheet, American looks the most leveraged at 81%, with Delta second at 64% and United coming out best at 55%.
But in truth the real affordability measures are based on ability to repay and with losses and cash burn continuing for at least another year, I think there are likely to be more calls on shareholders coming in 2021.
Delta looks to be in the best position here, with a much higher market capitalisation than either of the other two.

Source: finance.yahoo.com
To be honest, I am a little puzzled as to why Delta’s market capitalisation has remained so high.
Granted it has lost 43% of its value since the start of the year, representing a $16.8 billion loss of value. But more than half of that value drop can be accounted for purely by the increase in net debt and their losses on overseas investments since the start of the year. That doesn’t leave much for the loss of positive cashflows that should have been generated this year, or for at least another 12 months of difficult times ahead.
Even if Delta has managed to reduce employment costs by 20%, the loss of PSP grant money will still leave it losing over $2 billion a quarter. Revenues may improve a bit as we go into Q4, but a $20 billion valuation looks hard to justify.