
An inflection point for the European network carriers

The Q3 results are out
All three of the big European network carrier groups have now reported their Q3 results and they were all in positive mood. Luis Gallego, IAG’s Chief Executive, described the results as signifying an inflection point, with the company starting to generate rather than consume cash for the first time since the pandemic began.
Inflection points mark the moment when the trend changes. In this case, it marks the shift from survival to recovery mode. As travel restrictions have eased, demand is coming back and capacity is being restored. I thought it would be a good moment to look at how well each of the three has managed to contain the financial damage of the survival phase and to consider how well each is placed for the recovery phase.
Before we look at the past or the future, let’s take a quick look at what the Q3 figures showed for current performance.
Q3 performance
Air France - KLM never cut capacity as much as the other two did during the pandemic and has been running over 40% of their 2019 capacity since the last quarter of 2020. That’s a milestone that the other two only passed in the latest quarter. The UK and Ireland have both been much restrictive in 2021 and have been slower to ease their travel restrictions compared to Continental Europe. The impact of that is clear to see in IAG’s lagging capacity recovery in 2021.

Source: Company reports, GridPoint analysis
As demand has started to recover, so has profitability. Both Lufthansa Group and AF-KLM managed to record a small operating profit in Q3, whilst IAG halved its operating losses compared to Q2.

Source: Company reports, GridPoint analysis
Despite operating substantially more capacity, Air France-KLM managed to achieve decent load factors (by post-pandemic standards), together with yields which were no worse than IAG’s. Lufthansa flew less than Air France-KLM, but made up for it with substantially higher yields.
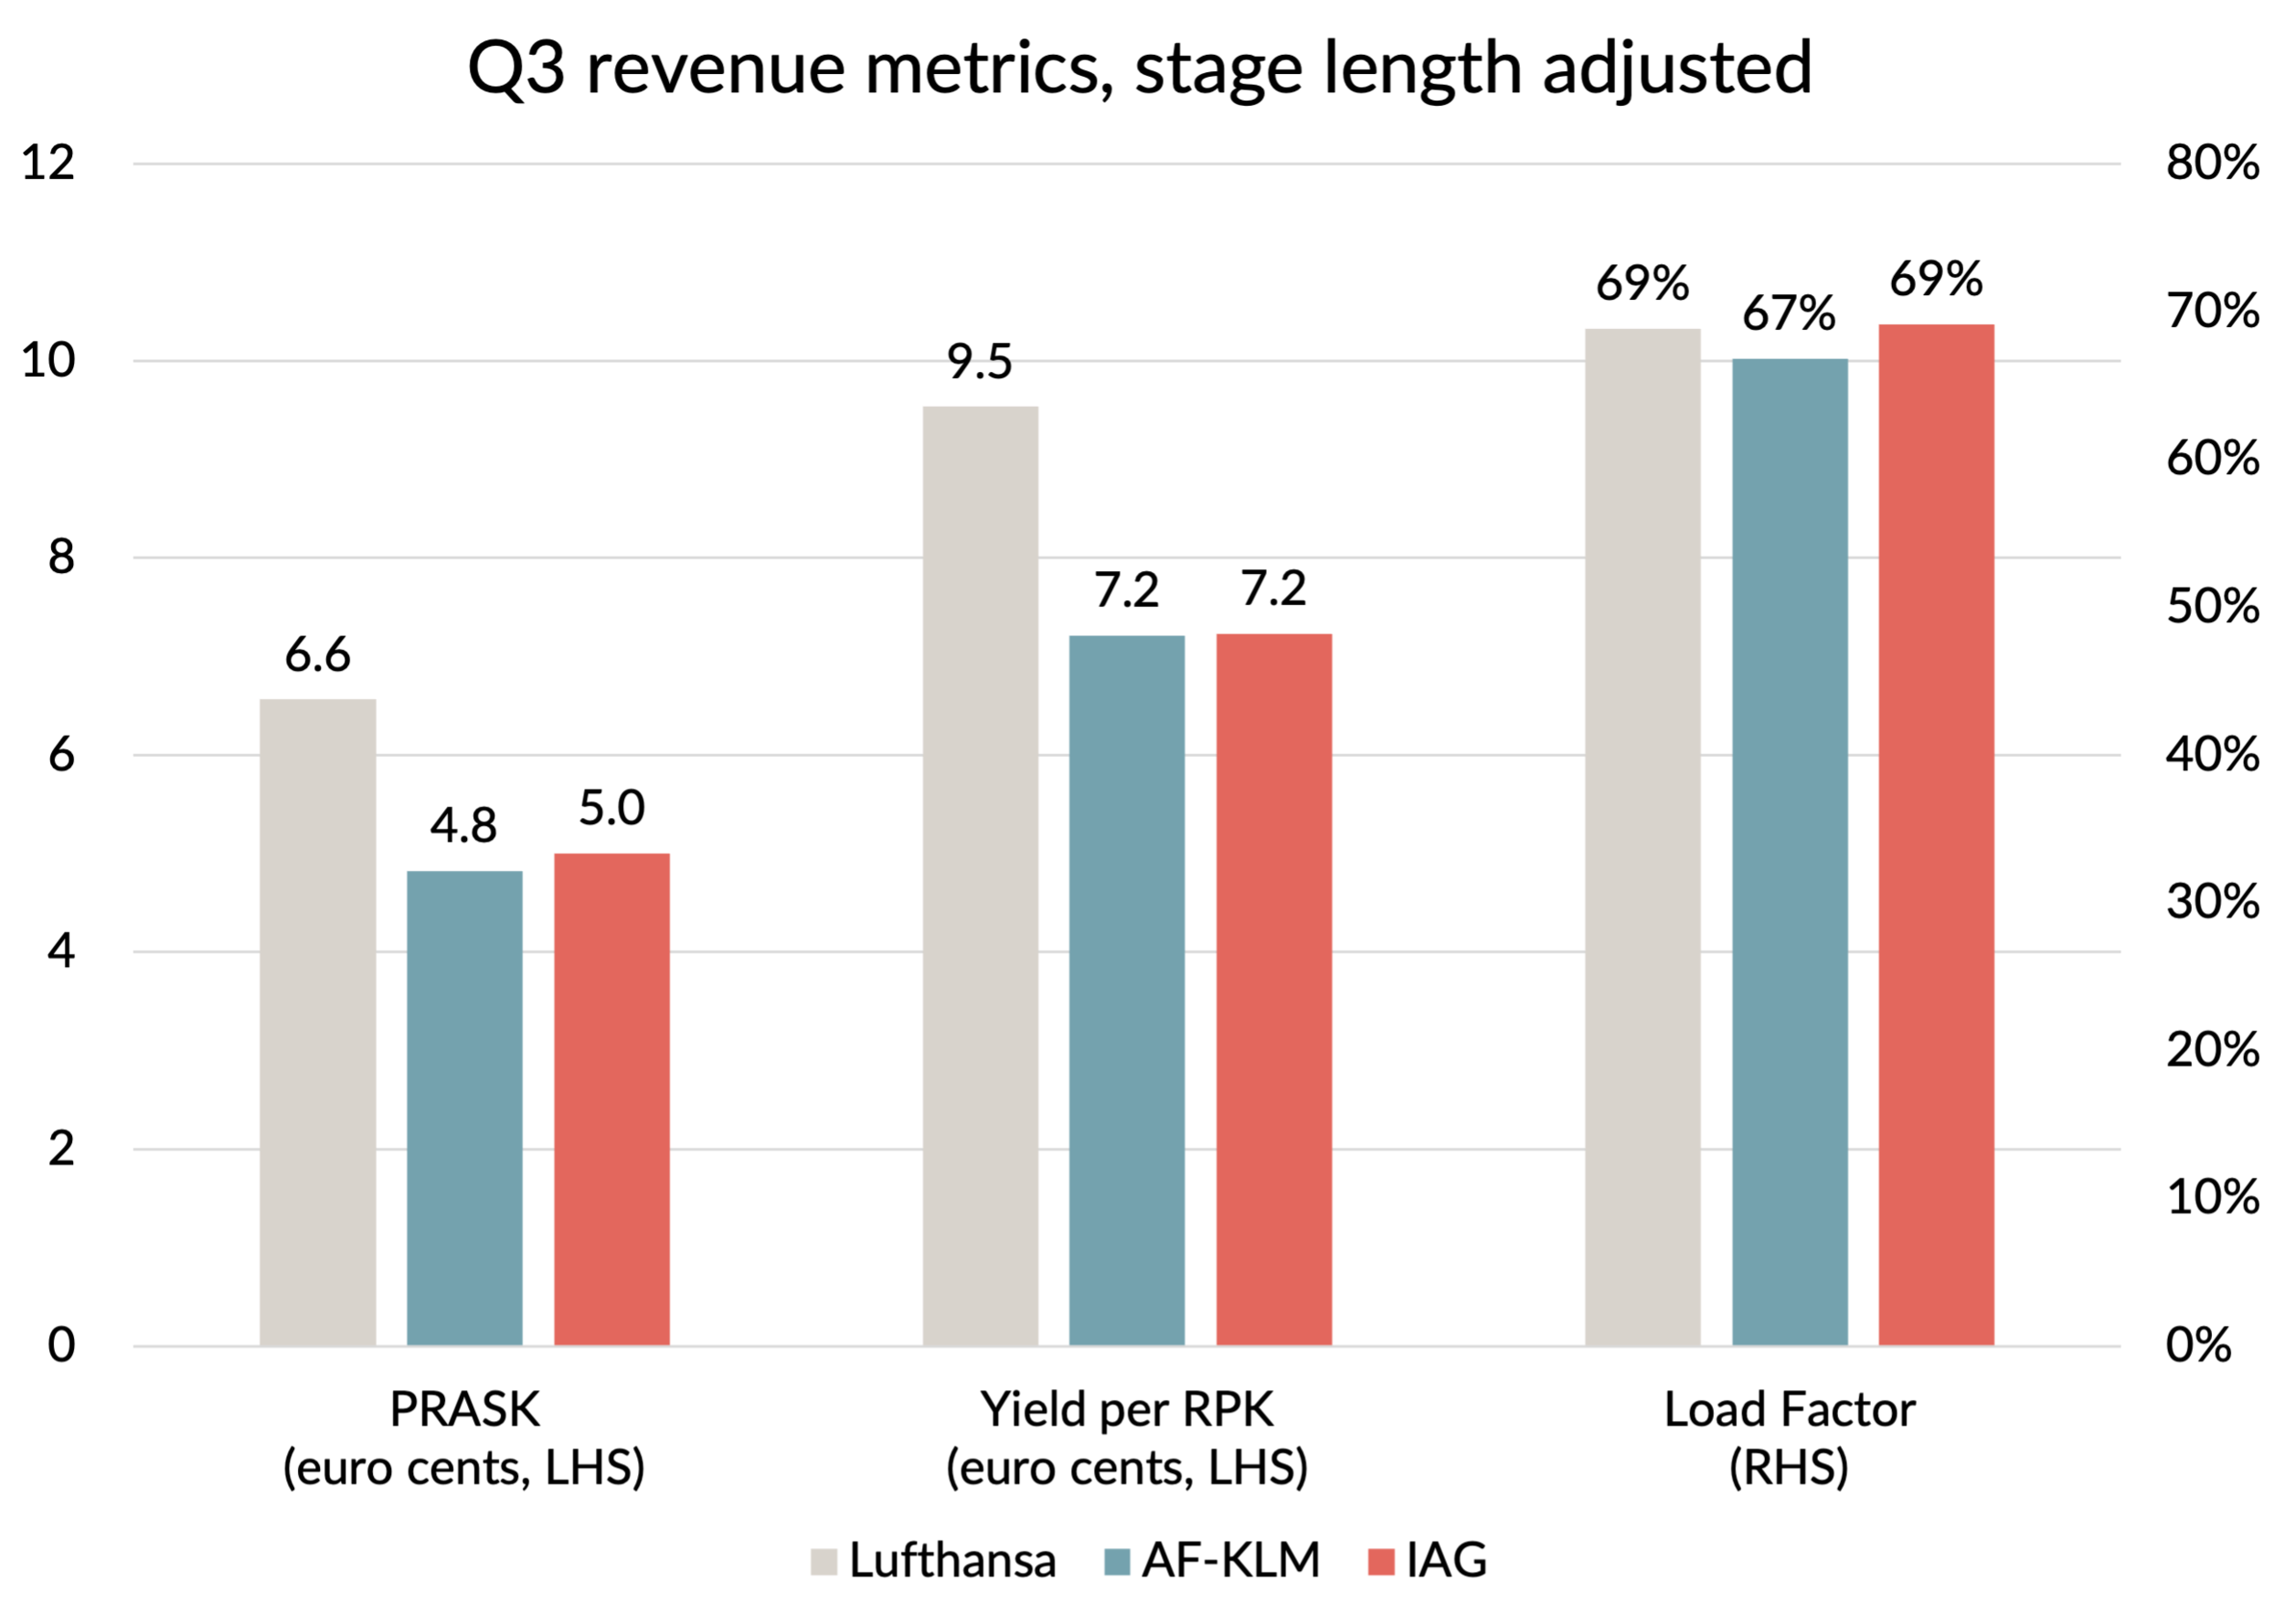
Source: Company reports, GridPoint analysis. PRASK and Yield adjusted to a stage length of 1,800 km.
As well as being bottom of the pile on passenger revenue, IAG also has a smaller cargo business than the other two, with less than half the cargo revenue in the quarter. Cargo has been one of the few bright spots for the industry during the pandemic, so that’s a big disadvantage.
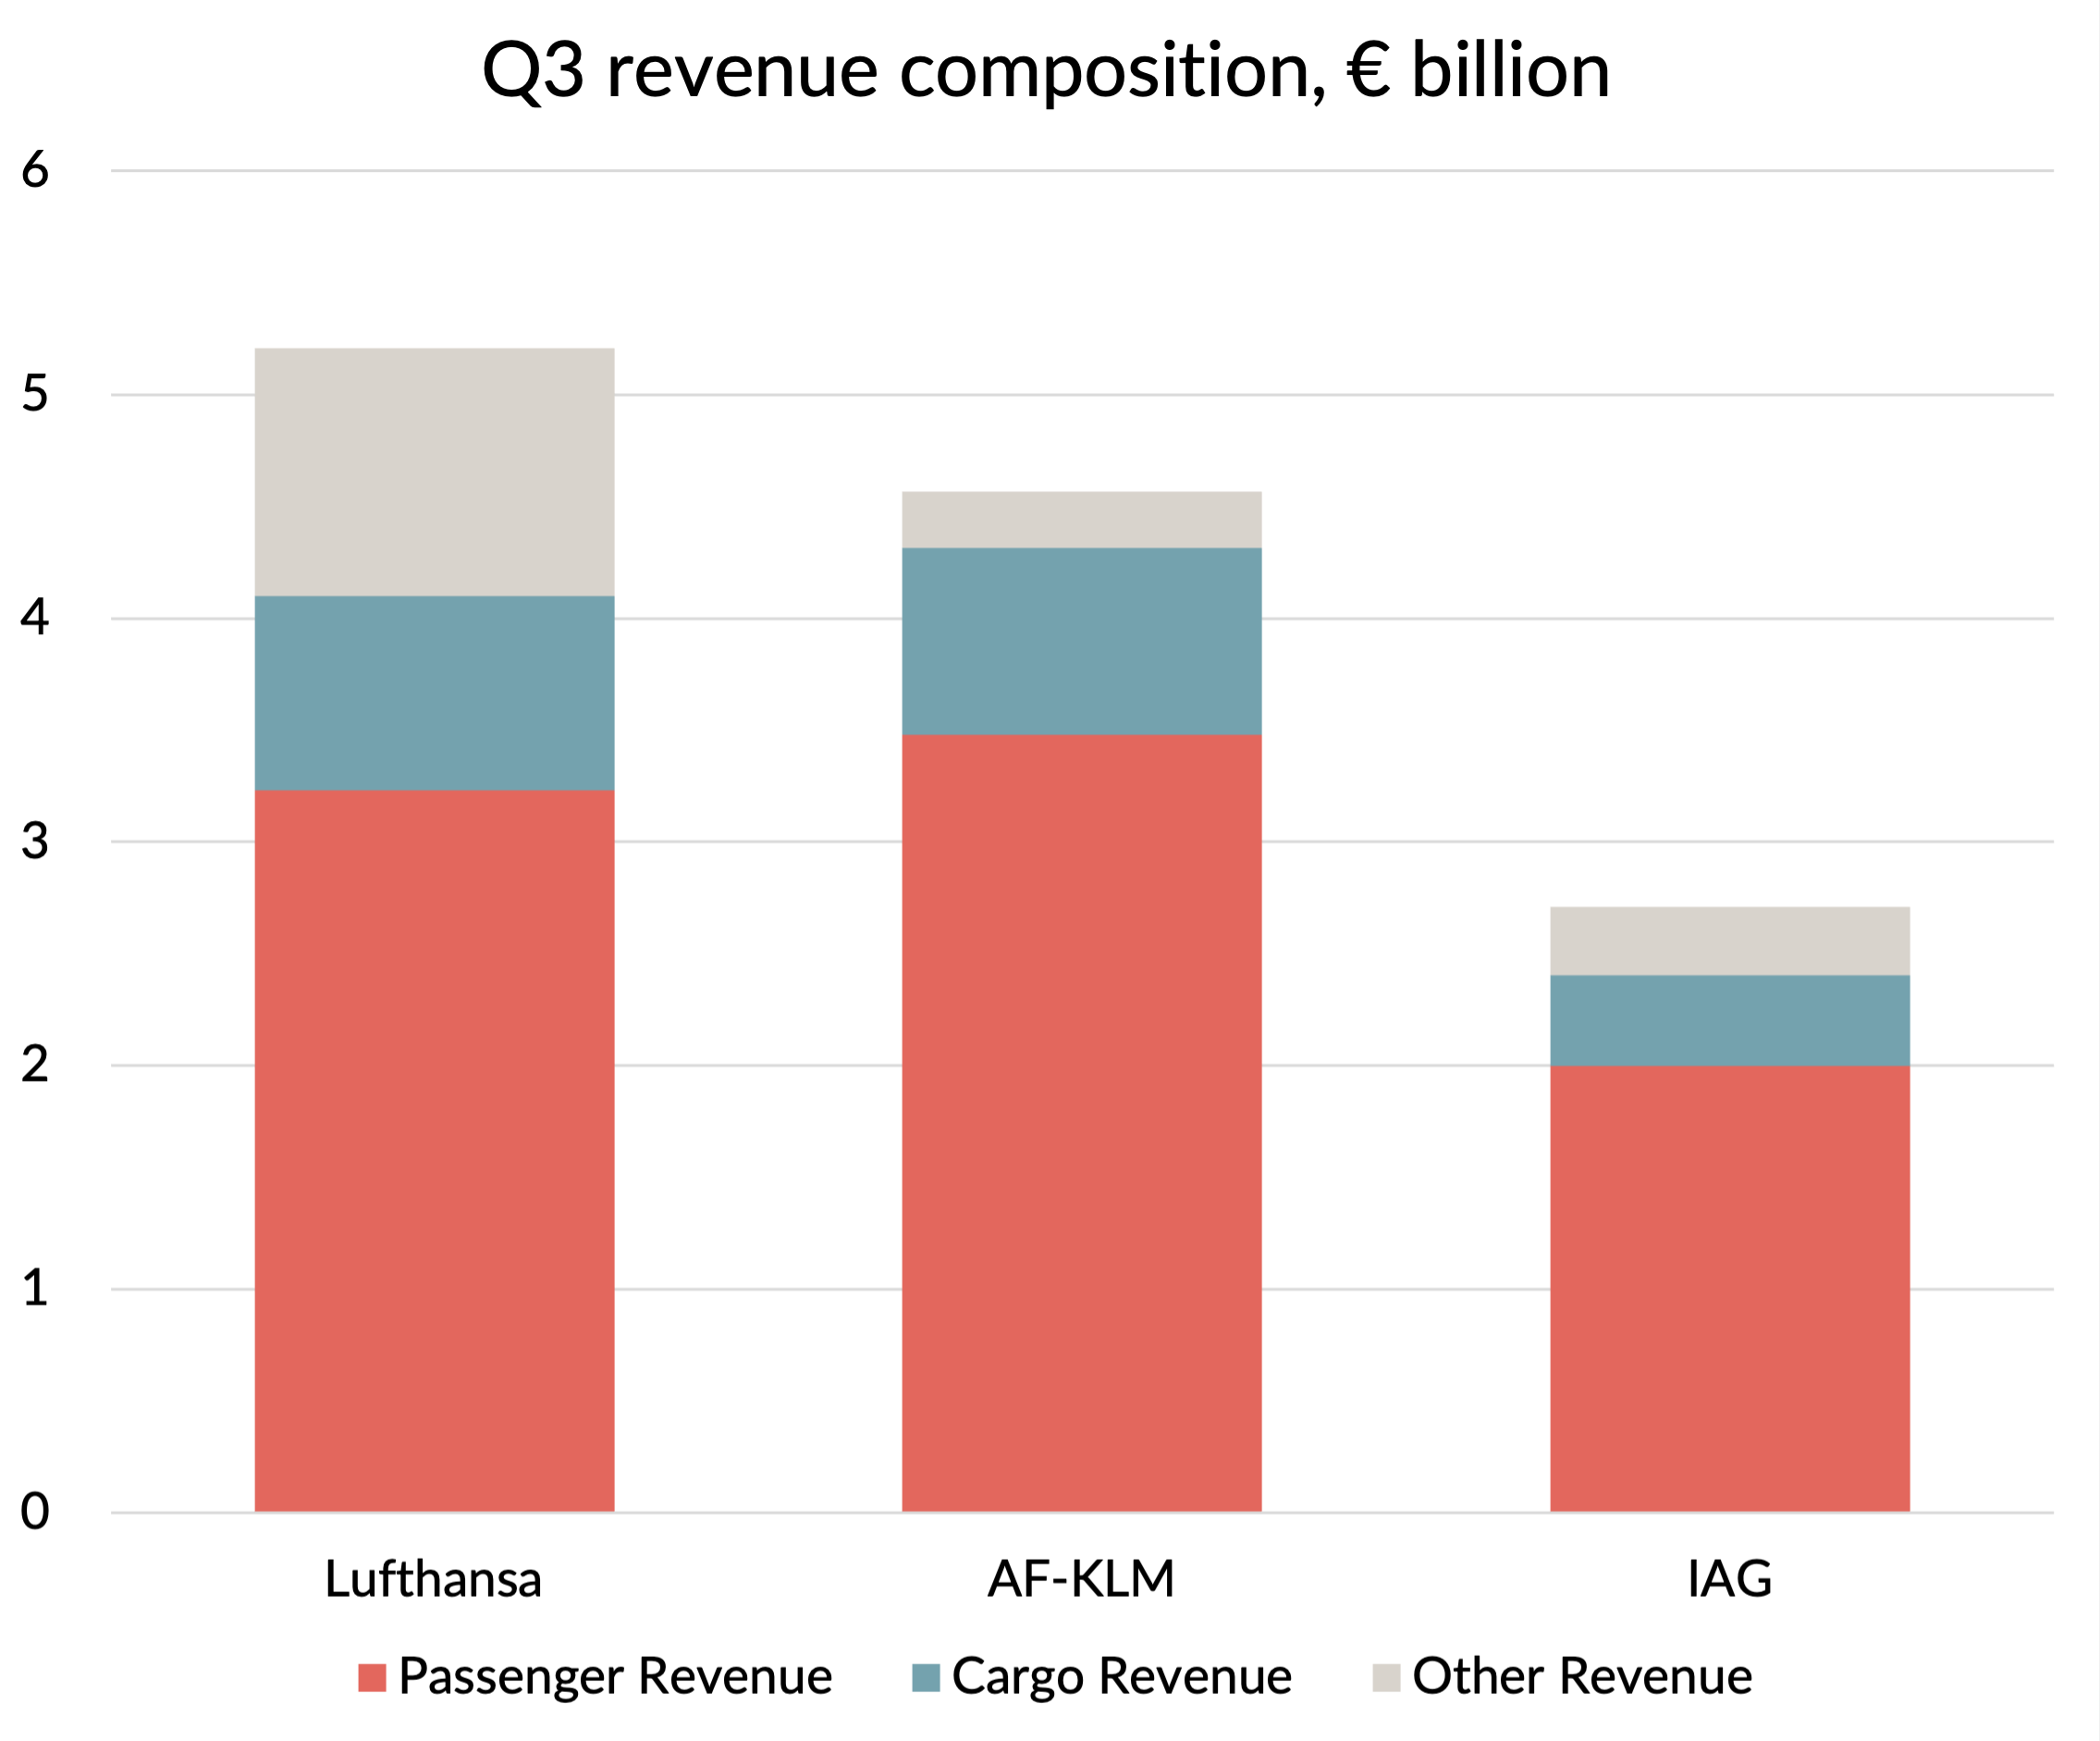
IAG’s revenue gap to the others is quite striking. Before the crisis, IAG and AF-KLM had almost identical revenue figures. It shows how hard IAG had to work in Q3 to keep the profit gap down to “only” half a billion euros. A look at the size and composition of the costs in the quarter shows how it did this. IAG’s depreciation costs were fairly similar to the others, as you might expect. The lower fuel bill is also easy to understand given the lower capacity operated. But it is the difference in employee costs that stands out. Some of that reflects a different level of outsourcing which will have a partial offset in other costs, but it is this fundamentally lower employee cost base that could put IAG in a good relative position once it stops being a laggard in terms of the revenue recovery.

Before we look at the future prospects, I want to take a moment to look back and consider how much financial damage has been inflicted on each company since the start of the pandemic. Let’s start with a profit and loss perspective.
Cumulative losses
Whether the losses are judged at an operating or PBT level, and with or without exceptional costs, the cumulative losses are remarkably similar across the three groups. Seven quarters of minimal revenue have caused cumulative losses after exceptional charges of between €10 and 11 billion at all three companies. The true cost to shareholders is higher of course, since the loss of profits that would have been earned also has to be taken into account too. Pretty eye-watering.

Source: Company reports, GridPoint analysis
The other approach to considering the financial damage is to look at the cumulative cash burn. Since all airlines seem to use a different definition, I’ve chosen to look at how much extra net debt each company has taken on since the start of the crisis. IAG comes out worst on that measure, with net debt €4.8 billion higher than at the start of 2020. That would have been higher still if it hadn’t raised €2.7 billion of new capital from its shareholders. Adjusting for that gives a figure for the cumulative cash burnt of a cool €7.5 billion.
I’ve done the same calculation for the other two. It is worth noting that whilst some of the new capital raised is in the form of proper equity, most of it is “quasi-equity” money from governments. The accountants have agreed to treat it in the company accounts as equity and therefore it doesn’t count towards the net debt totals. But it still needs to be repaid with interest before any money can be distributed to shareholders, so an ordinary shareholder might take issue with that definition. However, for the purposes of this exercise, it is correct to add back those values when estimating cash burn. In both cases, this calculation gives considerably lower figures for cash burn than at IAG, with Lufthansa in particular looking suspiciously low. How can you lose €10.9 billion pre-tax and only have only €4.4 billion of that impact on cash?

Source: Company reports, GridPoint analysis
Hunting for an answer to the mismatch between P&L and cash
In theory, it should be straightforward to answer the question of why the P&L and the net debt figures tell such different stories on cumulative losses. All three carriers report using the same International Accounting Standards, and provide a cashflow statement which allows the diligent analyst to work out how to reconcile the Profit and Loss account to the movement in cash and debt. However, the format of their cashflow statements is wildly different and trying to do any kind of comparison is frustrating, to say the least. There are some huge numbers to be found in line items whose descriptions basically amount to “other”. Nevertheless, I’ve given it a go and here are my conclusions.
Why is Lufthansa so much better than the others?
All three companies made big non-cash write downs in the values of their fleet and in their investments. However, these differed in size, with Lufthansa’s €1.9 billion write-down much bigger than IAG’s and AF-KLM’s write-downs of €0.9 billion and €0.7 billion respectively. That explains about a €1 billion of the reason why Lufthansa looks relatively better on a cash basis than it does on a P&L comparison.
When it comes to capital expenditure, AF-KLM spent the most over the period, with a total of €3.6 billion, followed by IAG at €2.6 billion and Lufthansa at €2.2 billion. But when you compare these figures to the annual depreciation charge, things come out much more obviously in favour of Lufthansa. They spent €2 billion less than their depreciation charge, whereas this figure at the other two airlines was less than half that. So we’ve found an explanation for another €1 billion.
One trick that Lufthansa were able to pull was to sell its "in the money" currency hedge positions, crystallising a €700m paper profit earned in earlier years into cash in mid 2020. I assume that these hedge positions were €/$ currency hedges which had been put in place to fix the € cost of future aircraft deliveries priced in $. Whilst closing these positions was very helpful for short-term cash, it will also mean that Lufthansa will pay more for its future aircraft deliveries than would have been the case otherwise. But we’ve located another €0.7 billion.
At this point, we’ve done enough to explain why Lufthansa comes out better than AF-KLM on cash burn, despite losing about the same amount of money. But we still have to explain why IAG was €1.5 billion worse than AF-KLM.
Why is IAG so much worse than the others?
The first area where IAG suffers compared to the others is the continued need to make deficit payments to the pension fund of BA. These don't impact the P&L, as the deficit is already reflected in the balance sheet. But they do hit cash and therefore also net debt. Whilst the company agreed some payment deferrals with the trustees of the fund, deficit payments still added up to €350m over the period of the crisis.
IAG has also incurred more cash restructuring costs than the others, with €460m paid out to right-size its work-force, whilst Lufthansa and AF-KLM have made greater use of temporary government schemes and early retirement programmes where the cash cost will only play out over the long term. You can see the difference in the approach by looking at the headcount information. IAG's manpower numbers have fallen by over 20%, whilst AF-KLM has reduced its much larger workforce by only 14%. Excluding Lufthansa Group's Catering division, where the numbers have fallen due to disposals, the company has reduced headcount by just 11%. It is hard to find figures for the cash costs of employee exits at Lufthansa and AF-KLM, but it seems that these were quite a bit lower in terms of cash drain over the period.
The next area where I think IAG was disadvantaged compared to the other two is tax rebates. Lufthansa specifically called out a €918m tax deferral in its 2020 results presentation. That isn’t itemised in its cashflow statement, but probably features somewhere in the “Change in other assets/shareholders’ equity and liabilities” line, a snappily titled line item which totalled almost €2 billion over the last seven quarters. I think that AF-KLM has had a similarly sized tax rebate. It isn’t singled out, but the cashflow statements over the last seven quarters contain a cumulative positive adjustment of €890m for “deferred tax” as a reconciling item between the profit and loss account and cash. Since the P&L already contained credits adding up to €158m over the period, I think that means they got a €1.1 billion cash tax rebate. Despite having paid considerably more corporate taxes over the last few years due to its much higher profitability, I can find no evidence of any such largess from the UK, Spanish or Irish governments in IAG’s accounts. So I think this accounts for about a €1 billion of the gap in IAG’s cash performance versus the other two, which neatly explains the remaining gap.
What about the future?
Whilst it is interesting to compare current and past performance, the most important thing now is what the future holds.
The last countries were removed from the UK’s red list on November 1st and the USA reopens to European travellers from November 8th. That will help all three companies, but will give a particularly big boost to IAG. The company said that long-haul bookings are now running at around 90% of 2019 levels and that it planned to operate capacity at 60% of 2019 levels in Q4, with 70% planned for December. They guided for a €3 billion operating loss before exceptional charges for the full year, which implies an operating loss for Q4 of about €480m, marginally better than Q3 and slightly positive for EBITDA.
Lufthansa’s guidance for Q4 was very similar to IAG’s, with capacity at 60% of 2019 and a positive result for EBITDA, even allowing for €80m of restructuring costs. With quarterly depreciation and amortisation of €559m, that suggests an operating loss before restructuring of €479m or better.
Air France - KLM said that Q4 capacity would be 70-75% of 2019 levels. That’s still higher than the other two operators, but the gap is narrowing. Like the others, it said that Q4 was expected to be positive at an EBITDA level.
When it comes to the outlook for 2022, IAG was the most forthcoming and the most optimistic. It said it planned to operate 100% of its pre-pandemic capacity on the North Atlantic by S22, with Iberia planning 85% on LATAM. In terms of profitability it expected to “return to profit” in 2022, although it is not clear what definition it is using for profit.
In terms of capacity for 2022, Lufthansa guided for ASKs at 65% of 2019 in Q1, and “above 70%” for the full year. It did say that it expected demand for leisure and VFR traffic to recover to 85% of 2019 levels for 2022 as a whole, although it expected corporate demand to recover only to 60%.
AF-KLM declined to give any guidance for 2022, citing uncertainty concerning the reopening of Asia. That’s an issue for all three carriers, but less so for IAG with its heavier Atlantic focus.
Conclusions
Pre-pandemic, IAG was performing much better than the other two big European carriers in terms of profitability. Since 2020, it has been a consistent under-performer, worse on pretty much all metrics, whether that is capacity levels, revenues or profitability. Lufthansa and AF-KLM’s more supportive governments have helped them weather the crisis, whilst IAG has had to do more through “self help”.
That’s taken its toll on IAG’s balance sheet, with net debt levels climbing further and faster than at its competitors. Even when it comes to the recovery phase, it has been lagging behind due to its dependency on the US and the UK markets, both of which were slow to reopen compared to other countries.
But it has also done more than the other two on costs, despite starting from a better place. That’s allowed it to contain cumulative losses, which are no worse overall. The impact on net debt levels looks worse, but I’d argue that most of the difference is really only a matter of the timing of cashflows which will reverse over the next year or two.
IAG has a relatively low exposure to Asia, which perhaps remains a disadvantage in terms of long-term growth. But for 2022, that looks like being a real positive. Its lower dependence on government assistance will also leave it better placed to act independently of political considerations.
As well as representing an inflection point for absolute performance, it looks to me like Q3 will also mark the point where the relative underperformance of IAG starts to reverse and the strengths of its lower costs and greater strategic freedom could start to pay dividends for shareholders again.
Although it is clearly going to be quite a while before those dividends are the kind that you can pay into your bank account.